Central American Indian vs Immigrants from Western Africa Median Household Income
COMPARE
Central American Indian
Immigrants from Western Africa
Median Household Income
Median Household Income Comparison
Central American Indians
Immigrants from Western Africa
$74,847
MEDIAN HOUSEHOLD INCOME
0.1/ 100
METRIC RATING
282nd/ 347
METRIC RANK
$79,490
MEDIAN HOUSEHOLD INCOME
2.7/ 100
METRIC RATING
240th/ 347
METRIC RANK
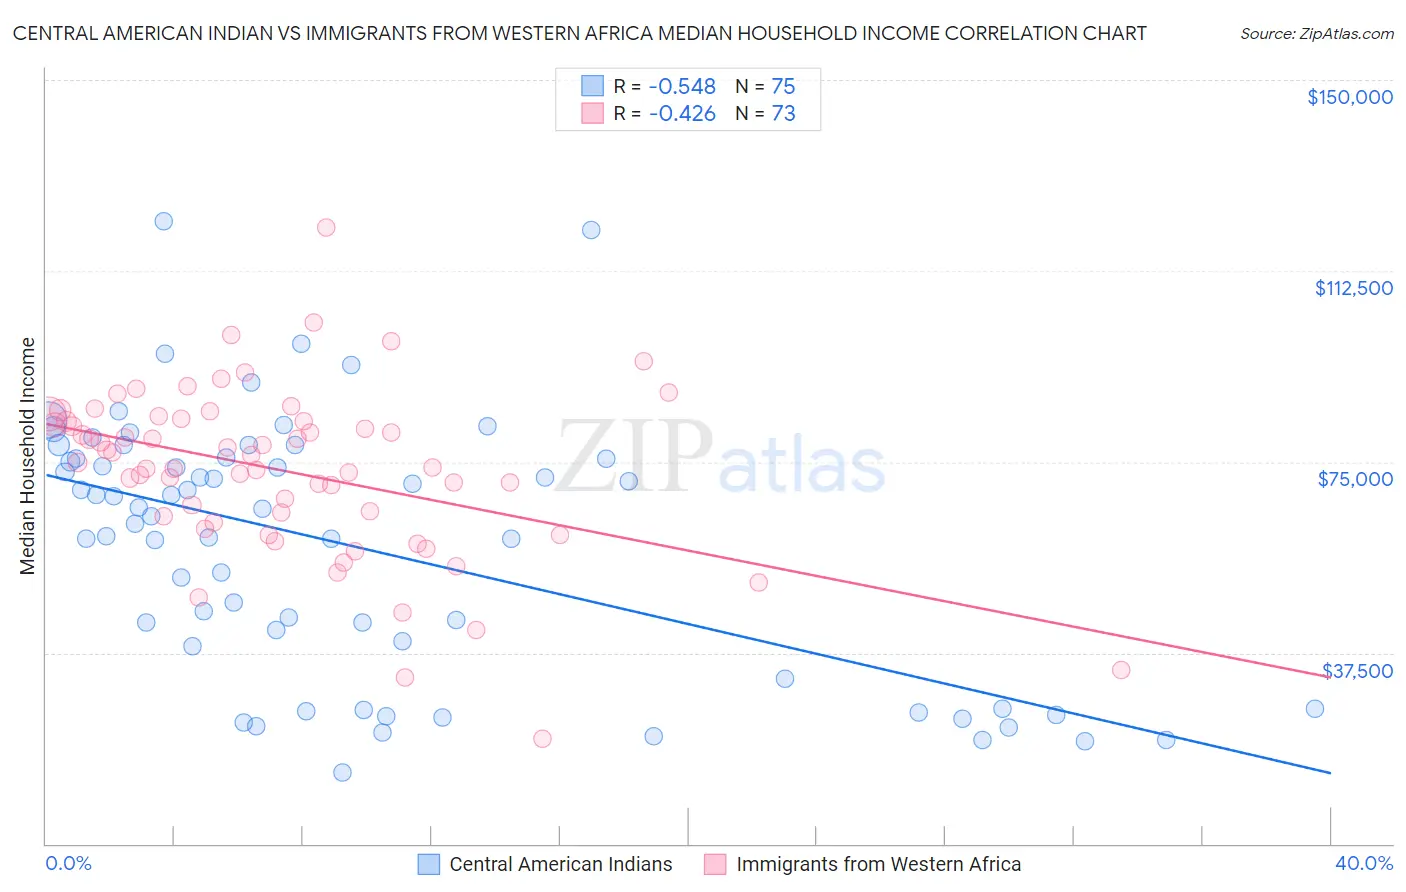
Central American Indian vs Immigrants from Western Africa Median Household Income Correlation Chart
The statistical analysis conducted on geographies consisting of 326,011,842 people shows a substantial negative correlation between the proportion of Central American Indians and median household income in the United States with a correlation coefficient (R) of -0.548 and weighted average of $74,847. Similarly, the statistical analysis conducted on geographies consisting of 357,459,311 people shows a moderate negative correlation between the proportion of Immigrants from Western Africa and median household income in the United States with a correlation coefficient (R) of -0.426 and weighted average of $79,490, a difference of 6.2%.
Median Household Income Correlation Summary
| Measurement | Central American Indian | Immigrants from Western Africa |
| Minimum | $14,073 | $20,699 |
| Maximum | $122,237 | $120,953 |
| Range | $108,164 | $100,254 |
| Mean | $58,298 | $73,270 |
| Median | $64,310 | $74,855 |
| Interquartile 25% (IQ1) | $32,456 | $63,706 |
| Interquartile 75% (IQ3) | $75,688 | $83,237 |
| Interquartile Range (IQR) | $43,232 | $19,531 |
| Standard Deviation (Sample) | $25,417 | $16,693 |
| Standard Deviation (Population) | $25,247 | $16,579 |
Similar Demographics by Median Household Income
Demographics Similar to Central American Indians by Median Household Income
In terms of median household income, the demographic groups most similar to Central American Indians are Immigrants from Liberia ($74,896, a difference of 0.070%), Senegalese ($74,999, a difference of 0.20%), Cree ($74,685, a difference of 0.22%), Yaqui ($74,596, a difference of 0.34%), and Immigrants from Guatemala ($75,123, a difference of 0.37%).
| Demographics | Rating | Rank | Median Household Income |
| Immigrants | Micronesia | 0.2 /100 | #275 | Tragic $75,574 |
| Immigrants | Latin America | 0.2 /100 | #276 | Tragic $75,420 |
| Spanish Americans | 0.2 /100 | #277 | Tragic $75,386 |
| Osage | 0.2 /100 | #278 | Tragic $75,240 |
| Immigrants | Guatemala | 0.2 /100 | #279 | Tragic $75,123 |
| Senegalese | 0.2 /100 | #280 | Tragic $74,999 |
| Immigrants | Liberia | 0.1 /100 | #281 | Tragic $74,896 |
| Central American Indians | 0.1 /100 | #282 | Tragic $74,847 |
| Cree | 0.1 /100 | #283 | Tragic $74,685 |
| Yaqui | 0.1 /100 | #284 | Tragic $74,596 |
| Mexicans | 0.1 /100 | #285 | Tragic $74,399 |
| Immigrants | Somalia | 0.1 /100 | #286 | Tragic $74,300 |
| Iroquois | 0.1 /100 | #287 | Tragic $74,279 |
| Immigrants | Central America | 0.1 /100 | #288 | Tragic $74,217 |
| Fijians | 0.1 /100 | #289 | Tragic $74,205 |
Demographics Similar to Immigrants from Western Africa by Median Household Income
In terms of median household income, the demographic groups most similar to Immigrants from Western Africa are Alaska Native ($79,509, a difference of 0.020%), Nonimmigrants ($79,429, a difference of 0.080%), Barbadian ($79,664, a difference of 0.22%), Nicaraguan ($79,737, a difference of 0.31%), and Immigrants from Sudan ($79,103, a difference of 0.49%).
| Demographics | Rating | Rank | Median Household Income |
| Immigrants | Azores | 4.5 /100 | #233 | Tragic $80,357 |
| Immigrants | Ecuador | 4.5 /100 | #234 | Tragic $80,341 |
| Immigrants | Guyana | 4.5 /100 | #235 | Tragic $80,324 |
| Immigrants | Bosnia and Herzegovina | 3.4 /100 | #236 | Tragic $79,888 |
| Nicaraguans | 3.1 /100 | #237 | Tragic $79,737 |
| Barbadians | 3.0 /100 | #238 | Tragic $79,664 |
| Alaska Natives | 2.7 /100 | #239 | Tragic $79,509 |
| Immigrants | Western Africa | 2.7 /100 | #240 | Tragic $79,490 |
| Immigrants | Nonimmigrants | 2.6 /100 | #241 | Tragic $79,429 |
| Immigrants | Sudan | 2.1 /100 | #242 | Tragic $79,103 |
| Immigrants | Barbados | 1.9 /100 | #243 | Tragic $78,989 |
| Marshallese | 1.9 /100 | #244 | Tragic $78,930 |
| Inupiat | 1.8 /100 | #245 | Tragic $78,841 |
| Central Americans | 1.7 /100 | #246 | Tragic $78,803 |
| Immigrants | Burma/Myanmar | 1.6 /100 | #247 | Tragic $78,682 |