New Zealander vs Somali Householder Income Ages 25 - 44 years
COMPARE
New Zealander
Somali
Householder Income Ages 25 - 44 years
Householder Income Ages 25 - 44 years Comparison
New Zealanders
Somalis
$105,085
HOUSEHOLDER INCOME AGES 25 - 44 YEARS
99.7/ 100
METRIC RATING
64th/ 347
METRIC RANK
$83,752
HOUSEHOLDER INCOME AGES 25 - 44 YEARS
0.2/ 100
METRIC RATING
271st/ 347
METRIC RANK
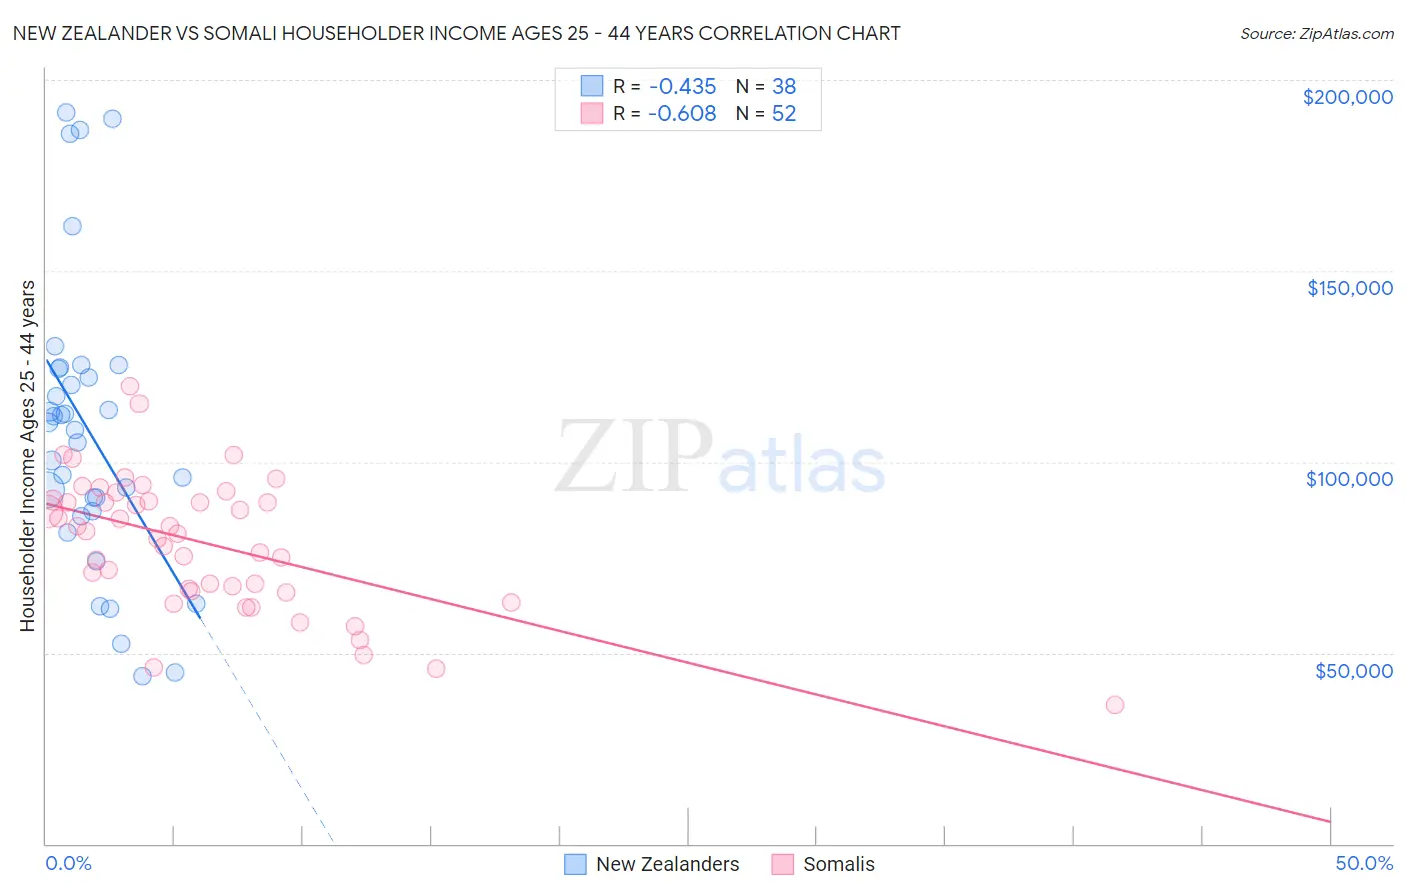
New Zealander vs Somali Householder Income Ages 25 - 44 years Correlation Chart
The statistical analysis conducted on geographies consisting of 106,878,711 people shows a moderate negative correlation between the proportion of New Zealanders and household income with householder between the ages 25 and 44 in the United States with a correlation coefficient (R) of -0.435 and weighted average of $105,085. Similarly, the statistical analysis conducted on geographies consisting of 99,259,991 people shows a significant negative correlation between the proportion of Somalis and household income with householder between the ages 25 and 44 in the United States with a correlation coefficient (R) of -0.608 and weighted average of $83,752, a difference of 25.5%.
Householder Income Ages 25 - 44 years Correlation Summary
| Measurement | New Zealander | Somali |
| Minimum | $43,917 | $36,409 |
| Maximum | $191,624 | $119,737 |
| Range | $147,707 | $83,328 |
| Mean | $108,113 | $78,789 |
| Median | $109,281 | $81,501 |
| Interquartile 25% (IQ1) | $87,015 | $66,569 |
| Interquartile 75% (IQ3) | $124,339 | $89,819 |
| Interquartile Range (IQR) | $37,324 | $23,250 |
| Standard Deviation (Sample) | $37,737 | $17,508 |
| Standard Deviation (Population) | $37,238 | $17,339 |
Similar Demographics by Householder Income Ages 25 - 44 years
Demographics Similar to New Zealanders by Householder Income Ages 25 - 44 years
In terms of householder income ages 25 - 44 years, the demographic groups most similar to New Zealanders are Immigrants from Scotland ($105,089, a difference of 0.0%), Immigrants from Netherlands ($105,082, a difference of 0.0%), Laotian ($104,993, a difference of 0.090%), Immigrants from Italy ($105,201, a difference of 0.11%), and Lithuanian ($105,223, a difference of 0.13%).
| Demographics | Rating | Rank | Householder Income Ages 25 - 44 years |
| Immigrants | Austria | 99.8 /100 | #57 | Exceptional $106,103 |
| Immigrants | South Africa | 99.8 /100 | #58 | Exceptional $105,748 |
| Immigrants | Latvia | 99.8 /100 | #59 | Exceptional $105,522 |
| Egyptians | 99.7 /100 | #60 | Exceptional $105,282 |
| Lithuanians | 99.7 /100 | #61 | Exceptional $105,223 |
| Immigrants | Italy | 99.7 /100 | #62 | Exceptional $105,201 |
| Immigrants | Scotland | 99.7 /100 | #63 | Exceptional $105,089 |
| New Zealanders | 99.7 /100 | #64 | Exceptional $105,085 |
| Immigrants | Netherlands | 99.7 /100 | #65 | Exceptional $105,082 |
| Laotians | 99.7 /100 | #66 | Exceptional $104,993 |
| Immigrants | Romania | 99.6 /100 | #67 | Exceptional $104,713 |
| Immigrants | Eastern Europe | 99.6 /100 | #68 | Exceptional $104,662 |
| Mongolians | 99.6 /100 | #69 | Exceptional $104,578 |
| Immigrants | Croatia | 99.6 /100 | #70 | Exceptional $104,503 |
| Afghans | 99.6 /100 | #71 | Exceptional $104,410 |
Demographics Similar to Somalis by Householder Income Ages 25 - 44 years
In terms of householder income ages 25 - 44 years, the demographic groups most similar to Somalis are Spanish American ($83,722, a difference of 0.040%), Iroquois ($83,682, a difference of 0.080%), Marshallese ($83,575, a difference of 0.21%), Jamaican ($83,933, a difference of 0.22%), and Spanish American Indian ($84,085, a difference of 0.40%).
| Demographics | Rating | Rank | Householder Income Ages 25 - 44 years |
| Osage | 0.4 /100 | #264 | Tragic $84,461 |
| Sudanese | 0.4 /100 | #265 | Tragic $84,401 |
| Immigrants | Cabo Verde | 0.3 /100 | #266 | Tragic $84,304 |
| Hmong | 0.3 /100 | #267 | Tragic $84,258 |
| Sub-Saharan Africans | 0.3 /100 | #268 | Tragic $84,235 |
| Spanish American Indians | 0.3 /100 | #269 | Tragic $84,085 |
| Jamaicans | 0.3 /100 | #270 | Tragic $83,933 |
| Somalis | 0.2 /100 | #271 | Tragic $83,752 |
| Spanish Americans | 0.2 /100 | #272 | Tragic $83,722 |
| Iroquois | 0.2 /100 | #273 | Tragic $83,682 |
| Marshallese | 0.2 /100 | #274 | Tragic $83,575 |
| Immigrants | Jamaica | 0.2 /100 | #275 | Tragic $83,298 |
| Immigrants | Belize | 0.2 /100 | #276 | Tragic $83,141 |
| Paiute | 0.2 /100 | #277 | Tragic $82,984 |
| Senegalese | 0.2 /100 | #278 | Tragic $82,852 |