Cape Verdean vs Somali Householder Income Ages 25 - 44 years
COMPARE
Cape Verdean
Somali
Householder Income Ages 25 - 44 years
Householder Income Ages 25 - 44 years Comparison
Cape Verdeans
Somalis
$85,758
HOUSEHOLDER INCOME AGES 25 - 44 YEARS
0.8/ 100
METRIC RATING
251st/ 347
METRIC RANK
$83,752
HOUSEHOLDER INCOME AGES 25 - 44 YEARS
0.2/ 100
METRIC RATING
271st/ 347
METRIC RANK
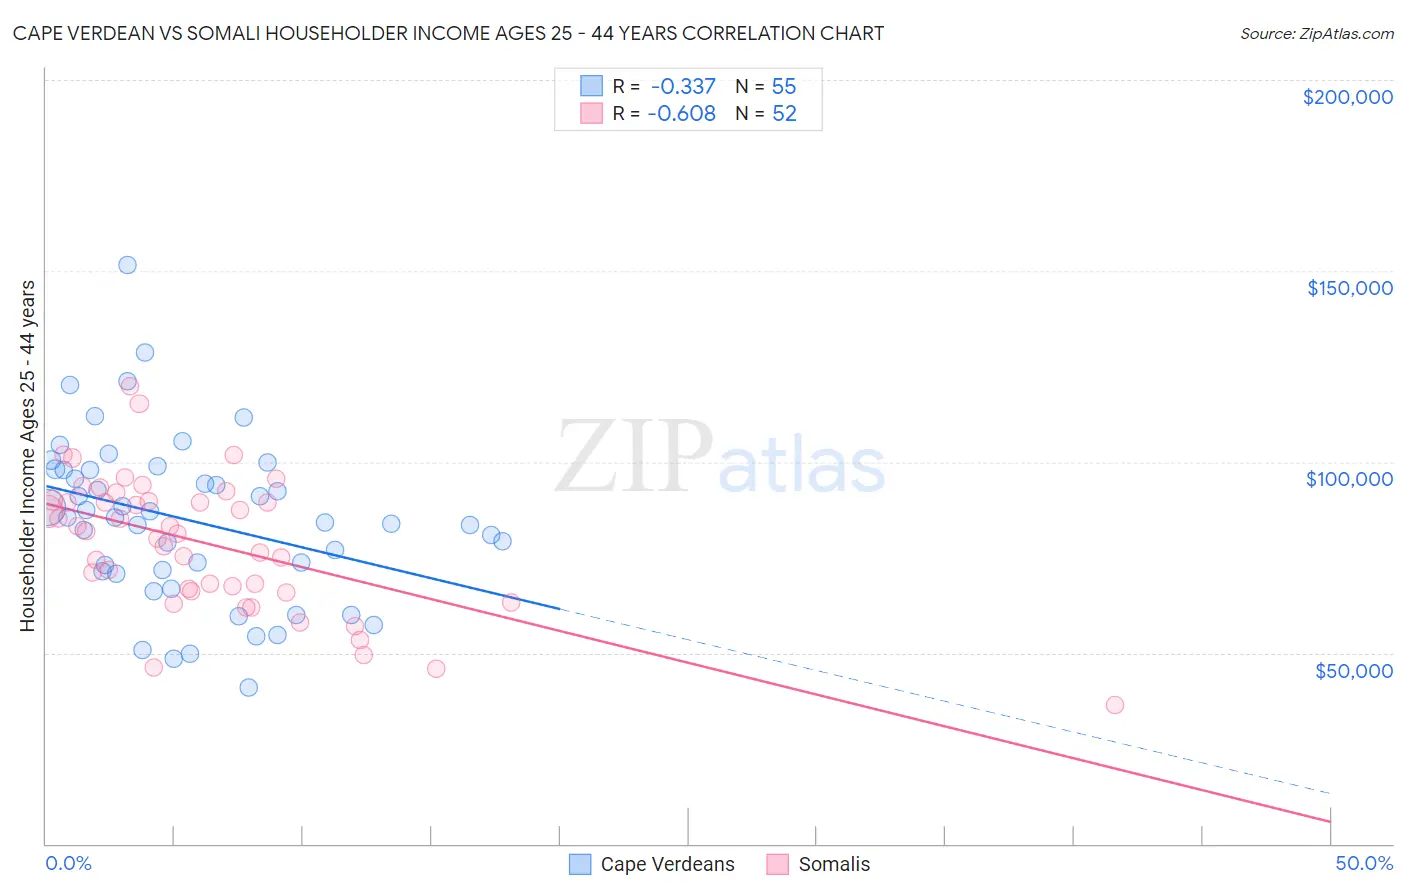
Cape Verdean vs Somali Householder Income Ages 25 - 44 years Correlation Chart
The statistical analysis conducted on geographies consisting of 107,474,022 people shows a mild negative correlation between the proportion of Cape Verdeans and household income with householder between the ages 25 and 44 in the United States with a correlation coefficient (R) of -0.337 and weighted average of $85,758. Similarly, the statistical analysis conducted on geographies consisting of 99,259,991 people shows a significant negative correlation between the proportion of Somalis and household income with householder between the ages 25 and 44 in the United States with a correlation coefficient (R) of -0.608 and weighted average of $83,752, a difference of 2.4%.
Householder Income Ages 25 - 44 years Correlation Summary
| Measurement | Cape Verdean | Somali |
| Minimum | $41,033 | $36,409 |
| Maximum | $151,693 | $119,737 |
| Range | $110,660 | $83,328 |
| Mean | $84,702 | $78,789 |
| Median | $85,334 | $81,501 |
| Interquartile 25% (IQ1) | $71,313 | $66,569 |
| Interquartile 75% (IQ3) | $97,942 | $89,819 |
| Interquartile Range (IQR) | $26,629 | $23,250 |
| Standard Deviation (Sample) | $21,551 | $17,508 |
| Standard Deviation (Population) | $21,354 | $17,339 |
Demographics Similar to Cape Verdeans and Somalis by Householder Income Ages 25 - 44 years
In terms of householder income ages 25 - 44 years, the demographic groups most similar to Cape Verdeans are Immigrants from Western Africa ($85,676, a difference of 0.10%), British West Indian ($85,565, a difference of 0.23%), Immigrants from Laos ($85,553, a difference of 0.24%), German Russian ($85,220, a difference of 0.63%), and Central American ($85,144, a difference of 0.72%). Similarly, the demographic groups most similar to Somalis are Jamaican ($83,933, a difference of 0.22%), Spanish American Indian ($84,085, a difference of 0.40%), Subsaharan African ($84,235, a difference of 0.58%), Hmong ($84,258, a difference of 0.60%), and Immigrants from Cabo Verde ($84,304, a difference of 0.66%).
| Demographics | Rating | Rank | Householder Income Ages 25 - 44 years |
| Cape Verdeans | 0.8 /100 | #251 | Tragic $85,758 |
| Immigrants | Western Africa | 0.7 /100 | #252 | Tragic $85,676 |
| British West Indians | 0.7 /100 | #253 | Tragic $85,565 |
| Immigrants | Laos | 0.7 /100 | #254 | Tragic $85,553 |
| German Russians | 0.6 /100 | #255 | Tragic $85,220 |
| Central Americans | 0.5 /100 | #256 | Tragic $85,144 |
| Mexican American Indians | 0.5 /100 | #257 | Tragic $85,066 |
| Immigrants | Nicaragua | 0.5 /100 | #258 | Tragic $84,914 |
| Immigrants | Senegal | 0.5 /100 | #259 | Tragic $84,848 |
| Americans | 0.4 /100 | #260 | Tragic $84,791 |
| Inupiat | 0.4 /100 | #261 | Tragic $84,619 |
| Cree | 0.4 /100 | #262 | Tragic $84,574 |
| Belizeans | 0.4 /100 | #263 | Tragic $84,534 |
| Osage | 0.4 /100 | #264 | Tragic $84,461 |
| Sudanese | 0.4 /100 | #265 | Tragic $84,401 |
| Immigrants | Cabo Verde | 0.3 /100 | #266 | Tragic $84,304 |
| Hmong | 0.3 /100 | #267 | Tragic $84,258 |
| Sub-Saharan Africans | 0.3 /100 | #268 | Tragic $84,235 |
| Spanish American Indians | 0.3 /100 | #269 | Tragic $84,085 |
| Jamaicans | 0.3 /100 | #270 | Tragic $83,933 |
| Somalis | 0.2 /100 | #271 | Tragic $83,752 |