Immigrants from Latvia vs Somali Householder Income Ages 25 - 44 years
COMPARE
Immigrants from Latvia
Somali
Householder Income Ages 25 - 44 years
Householder Income Ages 25 - 44 years Comparison
Immigrants from Latvia
Somalis
$105,522
HOUSEHOLDER INCOME AGES 25 - 44 YEARS
99.8/ 100
METRIC RATING
59th/ 347
METRIC RANK
$83,752
HOUSEHOLDER INCOME AGES 25 - 44 YEARS
0.2/ 100
METRIC RATING
271st/ 347
METRIC RANK
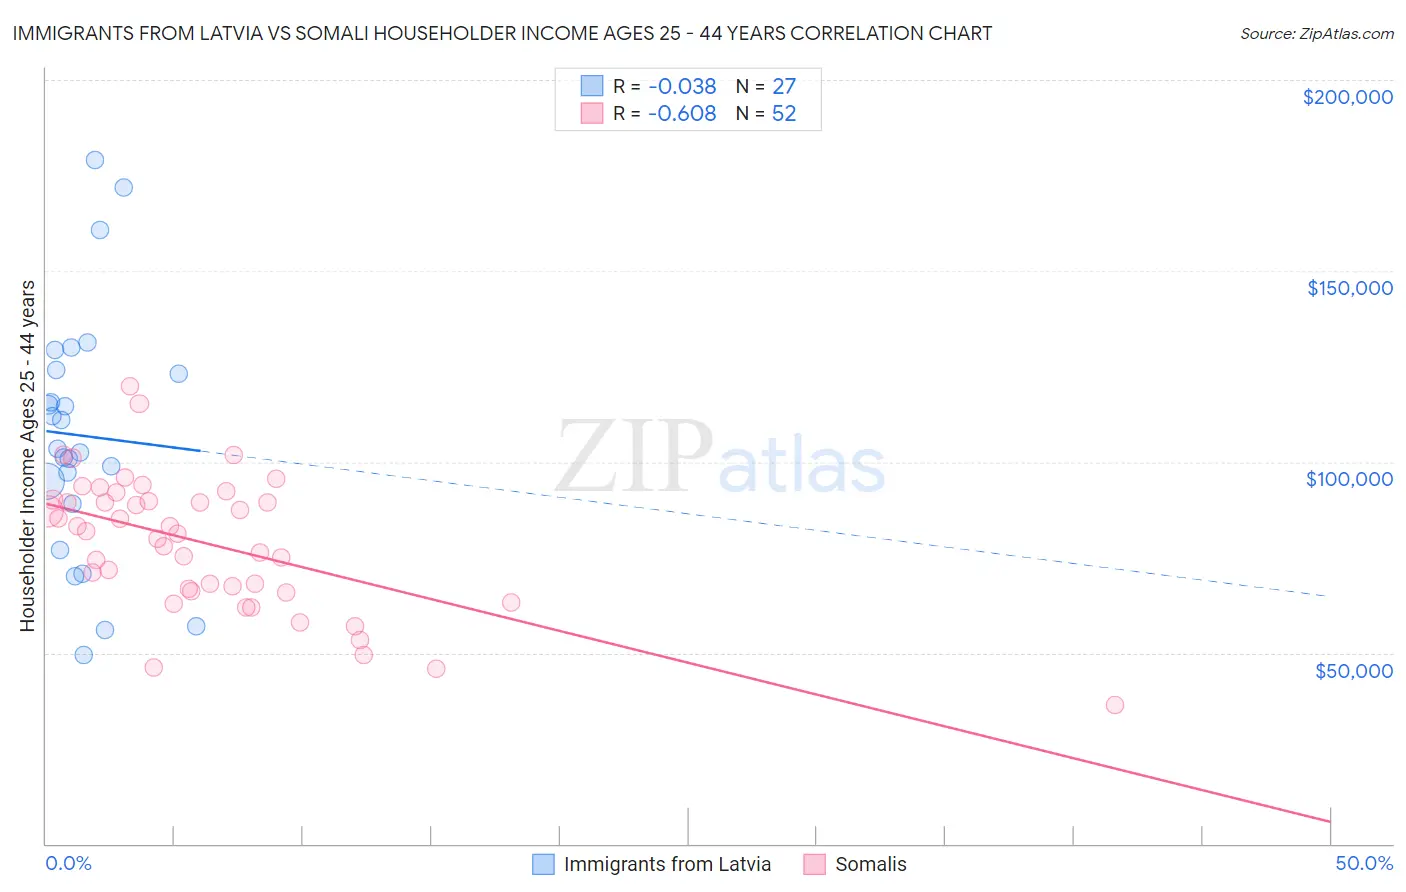
Immigrants from Latvia vs Somali Householder Income Ages 25 - 44 years Correlation Chart
The statistical analysis conducted on geographies consisting of 113,654,346 people shows no correlation between the proportion of Immigrants from Latvia and household income with householder between the ages 25 and 44 in the United States with a correlation coefficient (R) of -0.038 and weighted average of $105,522. Similarly, the statistical analysis conducted on geographies consisting of 99,259,991 people shows a significant negative correlation between the proportion of Somalis and household income with householder between the ages 25 and 44 in the United States with a correlation coefficient (R) of -0.608 and weighted average of $83,752, a difference of 26.0%.
Householder Income Ages 25 - 44 years Correlation Summary
| Measurement | Immigrants from Latvia | Somali |
| Minimum | $49,566 | $36,409 |
| Maximum | $179,160 | $119,737 |
| Range | $129,594 | $83,328 |
| Mean | $106,849 | $78,789 |
| Median | $103,593 | $81,501 |
| Interquartile 25% (IQ1) | $88,894 | $66,569 |
| Interquartile 75% (IQ3) | $124,010 | $89,819 |
| Interquartile Range (IQR) | $35,116 | $23,250 |
| Standard Deviation (Sample) | $32,483 | $17,508 |
| Standard Deviation (Population) | $31,876 | $17,339 |
Similar Demographics by Householder Income Ages 25 - 44 years
Demographics Similar to Immigrants from Latvia by Householder Income Ages 25 - 44 years
In terms of householder income ages 25 - 44 years, the demographic groups most similar to Immigrants from Latvia are Immigrants from South Africa ($105,748, a difference of 0.21%), Egyptian ($105,282, a difference of 0.23%), Lithuanian ($105,223, a difference of 0.28%), Immigrants from Italy ($105,201, a difference of 0.31%), and Immigrants from Scotland ($105,089, a difference of 0.41%).
| Demographics | Rating | Rank | Householder Income Ages 25 - 44 years |
| Immigrants | Europe | 99.9 /100 | #52 | Exceptional $106,817 |
| Immigrants | Norway | 99.9 /100 | #53 | Exceptional $106,629 |
| Paraguayans | 99.9 /100 | #54 | Exceptional $106,615 |
| Greeks | 99.9 /100 | #55 | Exceptional $106,457 |
| Immigrants | Pakistan | 99.8 /100 | #56 | Exceptional $106,129 |
| Immigrants | Austria | 99.8 /100 | #57 | Exceptional $106,103 |
| Immigrants | South Africa | 99.8 /100 | #58 | Exceptional $105,748 |
| Immigrants | Latvia | 99.8 /100 | #59 | Exceptional $105,522 |
| Egyptians | 99.7 /100 | #60 | Exceptional $105,282 |
| Lithuanians | 99.7 /100 | #61 | Exceptional $105,223 |
| Immigrants | Italy | 99.7 /100 | #62 | Exceptional $105,201 |
| Immigrants | Scotland | 99.7 /100 | #63 | Exceptional $105,089 |
| New Zealanders | 99.7 /100 | #64 | Exceptional $105,085 |
| Immigrants | Netherlands | 99.7 /100 | #65 | Exceptional $105,082 |
| Laotians | 99.7 /100 | #66 | Exceptional $104,993 |
Demographics Similar to Somalis by Householder Income Ages 25 - 44 years
In terms of householder income ages 25 - 44 years, the demographic groups most similar to Somalis are Spanish American ($83,722, a difference of 0.040%), Iroquois ($83,682, a difference of 0.080%), Marshallese ($83,575, a difference of 0.21%), Jamaican ($83,933, a difference of 0.22%), and Spanish American Indian ($84,085, a difference of 0.40%).
| Demographics | Rating | Rank | Householder Income Ages 25 - 44 years |
| Osage | 0.4 /100 | #264 | Tragic $84,461 |
| Sudanese | 0.4 /100 | #265 | Tragic $84,401 |
| Immigrants | Cabo Verde | 0.3 /100 | #266 | Tragic $84,304 |
| Hmong | 0.3 /100 | #267 | Tragic $84,258 |
| Sub-Saharan Africans | 0.3 /100 | #268 | Tragic $84,235 |
| Spanish American Indians | 0.3 /100 | #269 | Tragic $84,085 |
| Jamaicans | 0.3 /100 | #270 | Tragic $83,933 |
| Somalis | 0.2 /100 | #271 | Tragic $83,752 |
| Spanish Americans | 0.2 /100 | #272 | Tragic $83,722 |
| Iroquois | 0.2 /100 | #273 | Tragic $83,682 |
| Marshallese | 0.2 /100 | #274 | Tragic $83,575 |
| Immigrants | Jamaica | 0.2 /100 | #275 | Tragic $83,298 |
| Immigrants | Belize | 0.2 /100 | #276 | Tragic $83,141 |
| Paiute | 0.2 /100 | #277 | Tragic $82,984 |
| Senegalese | 0.2 /100 | #278 | Tragic $82,852 |