New Zealander vs Central American Indian Householder Income Ages 25 - 44 years
COMPARE
New Zealander
Central American Indian
Householder Income Ages 25 - 44 years
Householder Income Ages 25 - 44 years Comparison
New Zealanders
Central American Indians
$105,085
HOUSEHOLDER INCOME AGES 25 - 44 YEARS
99.7/ 100
METRIC RATING
64th/ 347
METRIC RANK
$82,355
HOUSEHOLDER INCOME AGES 25 - 44 YEARS
0.1/ 100
METRIC RATING
282nd/ 347
METRIC RANK
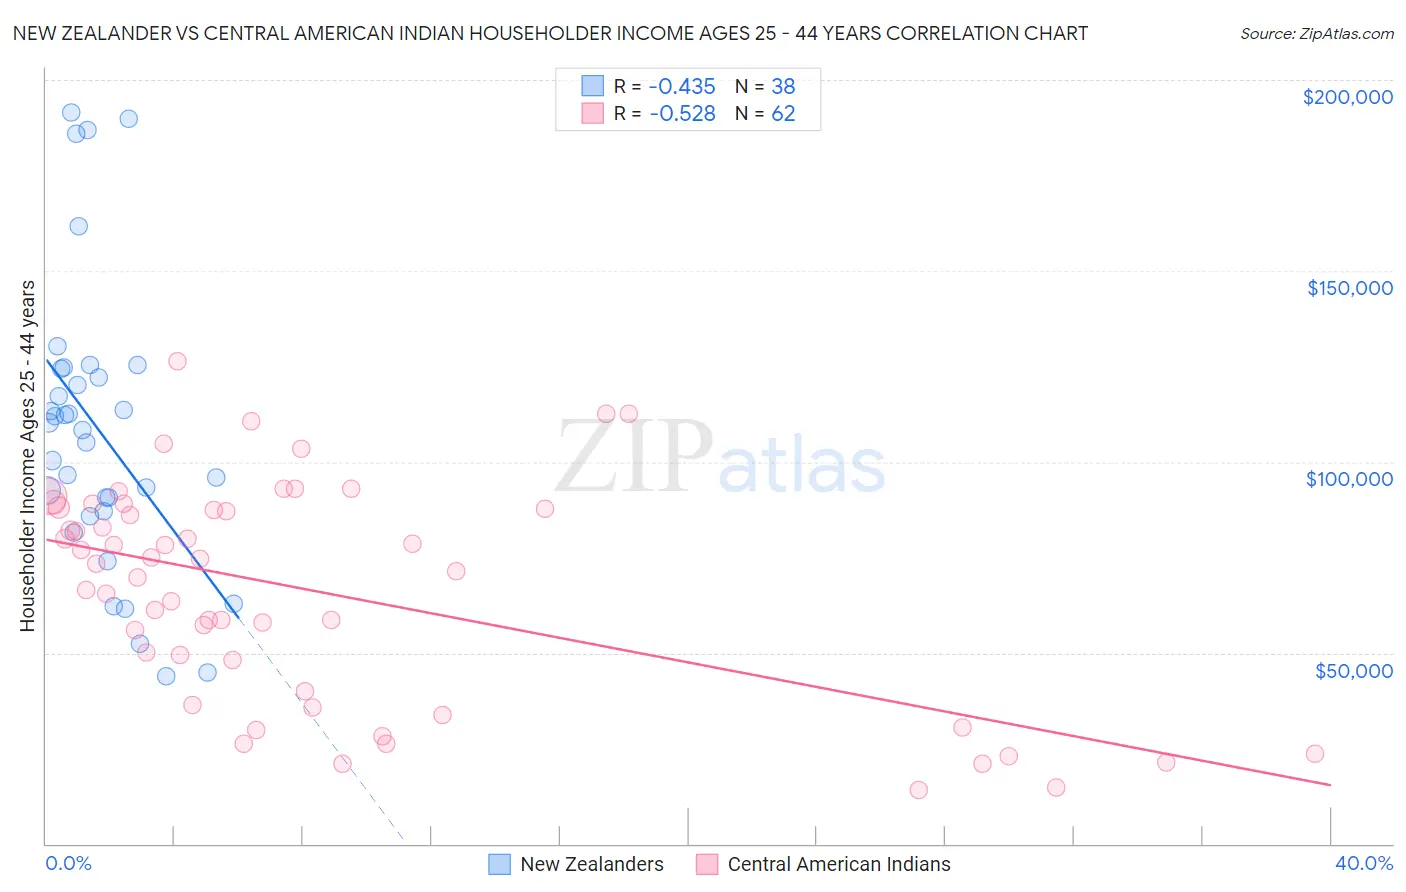
New Zealander vs Central American Indian Householder Income Ages 25 - 44 years Correlation Chart
The statistical analysis conducted on geographies consisting of 106,878,711 people shows a moderate negative correlation between the proportion of New Zealanders and household income with householder between the ages 25 and 44 in the United States with a correlation coefficient (R) of -0.435 and weighted average of $105,085. Similarly, the statistical analysis conducted on geographies consisting of 325,704,457 people shows a substantial negative correlation between the proportion of Central American Indians and household income with householder between the ages 25 and 44 in the United States with a correlation coefficient (R) of -0.528 and weighted average of $82,355, a difference of 27.6%.
Householder Income Ages 25 - 44 years Correlation Summary
| Measurement | New Zealander | Central American Indian |
| Minimum | $43,917 | $14,158 |
| Maximum | $191,624 | $126,501 |
| Range | $147,707 | $112,343 |
| Mean | $108,113 | $66,041 |
| Median | $109,281 | $72,238 |
| Interquartile 25% (IQ1) | $87,015 | $39,906 |
| Interquartile 75% (IQ3) | $124,339 | $87,781 |
| Interquartile Range (IQR) | $37,324 | $47,875 |
| Standard Deviation (Sample) | $37,737 | $28,438 |
| Standard Deviation (Population) | $37,238 | $28,208 |
Similar Demographics by Householder Income Ages 25 - 44 years
Demographics Similar to New Zealanders by Householder Income Ages 25 - 44 years
In terms of householder income ages 25 - 44 years, the demographic groups most similar to New Zealanders are Immigrants from Scotland ($105,089, a difference of 0.0%), Immigrants from Netherlands ($105,082, a difference of 0.0%), Laotian ($104,993, a difference of 0.090%), Immigrants from Italy ($105,201, a difference of 0.11%), and Lithuanian ($105,223, a difference of 0.13%).
| Demographics | Rating | Rank | Householder Income Ages 25 - 44 years |
| Immigrants | Austria | 99.8 /100 | #57 | Exceptional $106,103 |
| Immigrants | South Africa | 99.8 /100 | #58 | Exceptional $105,748 |
| Immigrants | Latvia | 99.8 /100 | #59 | Exceptional $105,522 |
| Egyptians | 99.7 /100 | #60 | Exceptional $105,282 |
| Lithuanians | 99.7 /100 | #61 | Exceptional $105,223 |
| Immigrants | Italy | 99.7 /100 | #62 | Exceptional $105,201 |
| Immigrants | Scotland | 99.7 /100 | #63 | Exceptional $105,089 |
| New Zealanders | 99.7 /100 | #64 | Exceptional $105,085 |
| Immigrants | Netherlands | 99.7 /100 | #65 | Exceptional $105,082 |
| Laotians | 99.7 /100 | #66 | Exceptional $104,993 |
| Immigrants | Romania | 99.6 /100 | #67 | Exceptional $104,713 |
| Immigrants | Eastern Europe | 99.6 /100 | #68 | Exceptional $104,662 |
| Mongolians | 99.6 /100 | #69 | Exceptional $104,578 |
| Immigrants | Croatia | 99.6 /100 | #70 | Exceptional $104,503 |
| Afghans | 99.6 /100 | #71 | Exceptional $104,410 |
Demographics Similar to Central American Indians by Householder Income Ages 25 - 44 years
In terms of householder income ages 25 - 44 years, the demographic groups most similar to Central American Indians are Guatemalan ($82,331, a difference of 0.030%), Cajun ($82,393, a difference of 0.050%), Immigrants from Middle Africa ($82,254, a difference of 0.12%), Immigrants from Somalia ($82,188, a difference of 0.20%), and Ute ($82,166, a difference of 0.23%).
| Demographics | Rating | Rank | Householder Income Ages 25 - 44 years |
| Immigrants | Jamaica | 0.2 /100 | #275 | Tragic $83,298 |
| Immigrants | Belize | 0.2 /100 | #276 | Tragic $83,141 |
| Paiute | 0.2 /100 | #277 | Tragic $82,984 |
| Senegalese | 0.2 /100 | #278 | Tragic $82,852 |
| Pima | 0.1 /100 | #279 | Tragic $82,821 |
| Colville | 0.1 /100 | #280 | Tragic $82,604 |
| Cajuns | 0.1 /100 | #281 | Tragic $82,393 |
| Central American Indians | 0.1 /100 | #282 | Tragic $82,355 |
| Guatemalans | 0.1 /100 | #283 | Tragic $82,331 |
| Immigrants | Middle Africa | 0.1 /100 | #284 | Tragic $82,254 |
| Immigrants | Somalia | 0.1 /100 | #285 | Tragic $82,188 |
| Ute | 0.1 /100 | #286 | Tragic $82,166 |
| Immigrants | Latin America | 0.1 /100 | #287 | Tragic $82,166 |
| Comanche | 0.1 /100 | #288 | Tragic $82,152 |
| Shoshone | 0.1 /100 | #289 | Tragic $82,062 |