New Zealander vs Somali Cognitive Disability
COMPARE
New Zealander
Somali
Cognitive Disability
Cognitive Disability Comparison
New Zealanders
Somalis
17.4%
COGNITIVE DISABILITY
21.1/ 100
METRIC RATING
195th/ 347
METRIC RANK
19.8%
COGNITIVE DISABILITY
0.0/ 100
METRIC RATING
345th/ 347
METRIC RANK
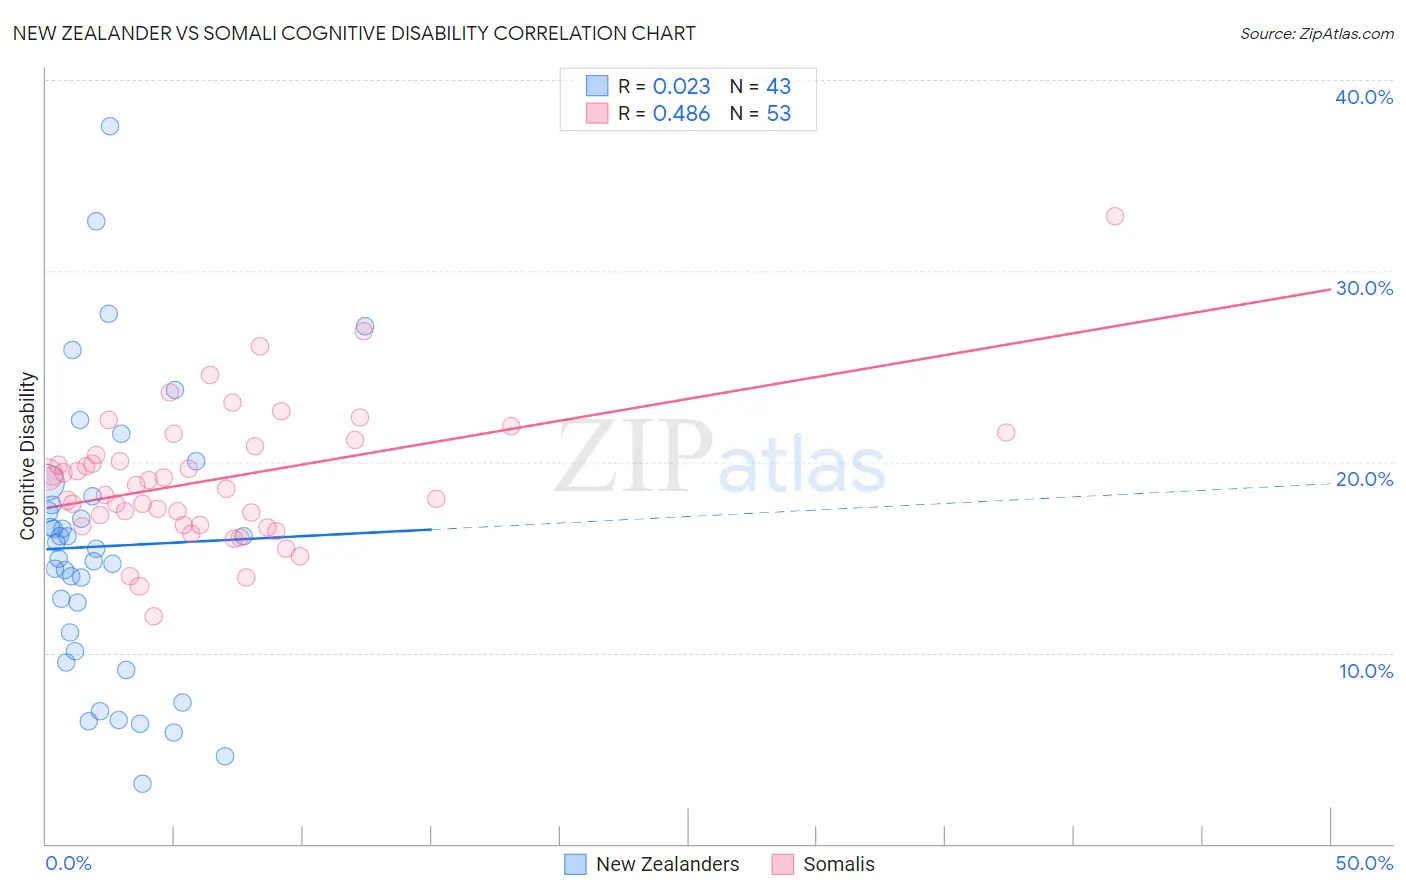
New Zealander vs Somali Cognitive Disability Correlation Chart
The statistical analysis conducted on geographies consisting of 106,922,503 people shows no correlation between the proportion of New Zealanders and percentage of population with cognitive disability in the United States with a correlation coefficient (R) of 0.023 and weighted average of 17.4%. Similarly, the statistical analysis conducted on geographies consisting of 99,318,466 people shows a moderate positive correlation between the proportion of Somalis and percentage of population with cognitive disability in the United States with a correlation coefficient (R) of 0.486 and weighted average of 19.8%, a difference of 13.7%.
Cognitive Disability Correlation Summary
| Measurement | New Zealander | Somali |
| Minimum | 3.1% | 11.9% |
| Maximum | 37.6% | 32.8% |
| Range | 34.5% | 20.9% |
| Mean | 15.6% | 19.1% |
| Median | 15.4% | 18.8% |
| Interquartile 25% (IQ1) | 10.1% | 16.7% |
| Interquartile 75% (IQ3) | 18.2% | 21.0% |
| Interquartile Range (IQR) | 8.2% | 4.3% |
| Standard Deviation (Sample) | 7.4% | 3.6% |
| Standard Deviation (Population) | 7.3% | 3.6% |
Similar Demographics by Cognitive Disability
Demographics Similar to New Zealanders by Cognitive Disability
In terms of cognitive disability, the demographic groups most similar to New Zealanders are Immigrants from Bosnia and Herzegovina (17.4%, a difference of 0.040%), Guyanese (17.5%, a difference of 0.16%), Delaware (17.4%, a difference of 0.18%), Immigrants from Afghanistan (17.5%, a difference of 0.20%), and Immigrants from Haiti (17.4%, a difference of 0.23%).
| Demographics | Rating | Rank | Cognitive Disability |
| Immigrants | France | 29.8 /100 | #188 | Fair 17.4% |
| Immigrants | Western Asia | 29.5 /100 | #189 | Fair 17.4% |
| Immigrants | Spain | 27.7 /100 | #190 | Fair 17.4% |
| Immigrants | Nonimmigrants | 27.4 /100 | #191 | Fair 17.4% |
| Immigrants | Haiti | 27.1 /100 | #192 | Fair 17.4% |
| Delaware | 25.6 /100 | #193 | Fair 17.4% |
| Immigrants | Bosnia and Herzegovina | 22.0 /100 | #194 | Fair 17.4% |
| New Zealanders | 21.1 /100 | #195 | Fair 17.4% |
| Guyanese | 17.5 /100 | #196 | Poor 17.5% |
| Immigrants | Afghanistan | 16.7 /100 | #197 | Poor 17.5% |
| Immigrants | Panama | 14.8 /100 | #198 | Poor 17.5% |
| Immigrants | Singapore | 14.3 /100 | #199 | Poor 17.5% |
| Haitians | 14.1 /100 | #200 | Poor 17.5% |
| South American Indians | 13.0 /100 | #201 | Poor 17.5% |
| Immigrants | Morocco | 12.0 /100 | #202 | Poor 17.5% |
Demographics Similar to Somalis by Cognitive Disability
In terms of cognitive disability, the demographic groups most similar to Somalis are Immigrants from Cabo Verde (19.9%, a difference of 0.16%), Immigrants from Congo (19.7%, a difference of 0.56%), Immigrants from Somalia (20.0%, a difference of 0.89%), Immigrants from Zaire (19.4%, a difference of 2.2%), and Tohono O'odham (19.3%, a difference of 2.9%).
| Demographics | Rating | Rank | Cognitive Disability |
| Immigrants | Yemen | 0.0 /100 | #333 | Tragic 18.8% |
| Sudanese | 0.0 /100 | #334 | Tragic 18.9% |
| Senegalese | 0.0 /100 | #335 | Tragic 19.0% |
| Blacks/African Americans | 0.0 /100 | #336 | Tragic 19.0% |
| Immigrants | Saudi Arabia | 0.0 /100 | #337 | Tragic 19.1% |
| Lumbee | 0.0 /100 | #338 | Tragic 19.1% |
| Puerto Ricans | 0.0 /100 | #339 | Tragic 19.2% |
| Cape Verdeans | 0.0 /100 | #340 | Tragic 19.2% |
| Tohono O'odham | 0.0 /100 | #341 | Tragic 19.3% |
| Houma | 0.0 /100 | #342 | Tragic 19.3% |
| Immigrants | Zaire | 0.0 /100 | #343 | Tragic 19.4% |
| Immigrants | Congo | 0.0 /100 | #344 | Tragic 19.7% |
| Somalis | 0.0 /100 | #345 | Tragic 19.8% |
| Immigrants | Cabo Verde | 0.0 /100 | #346 | Tragic 19.9% |
| Immigrants | Somalia | 0.0 /100 | #347 | Tragic 20.0% |