Seminole vs Somali Householder Income Ages 25 - 44 years
COMPARE
Seminole
Somali
Householder Income Ages 25 - 44 years
Householder Income Ages 25 - 44 years Comparison
Seminole
Somalis
$76,584
HOUSEHOLDER INCOME AGES 25 - 44 YEARS
0.0/ 100
METRIC RATING
329th/ 347
METRIC RANK
$83,752
HOUSEHOLDER INCOME AGES 25 - 44 YEARS
0.2/ 100
METRIC RATING
271st/ 347
METRIC RANK
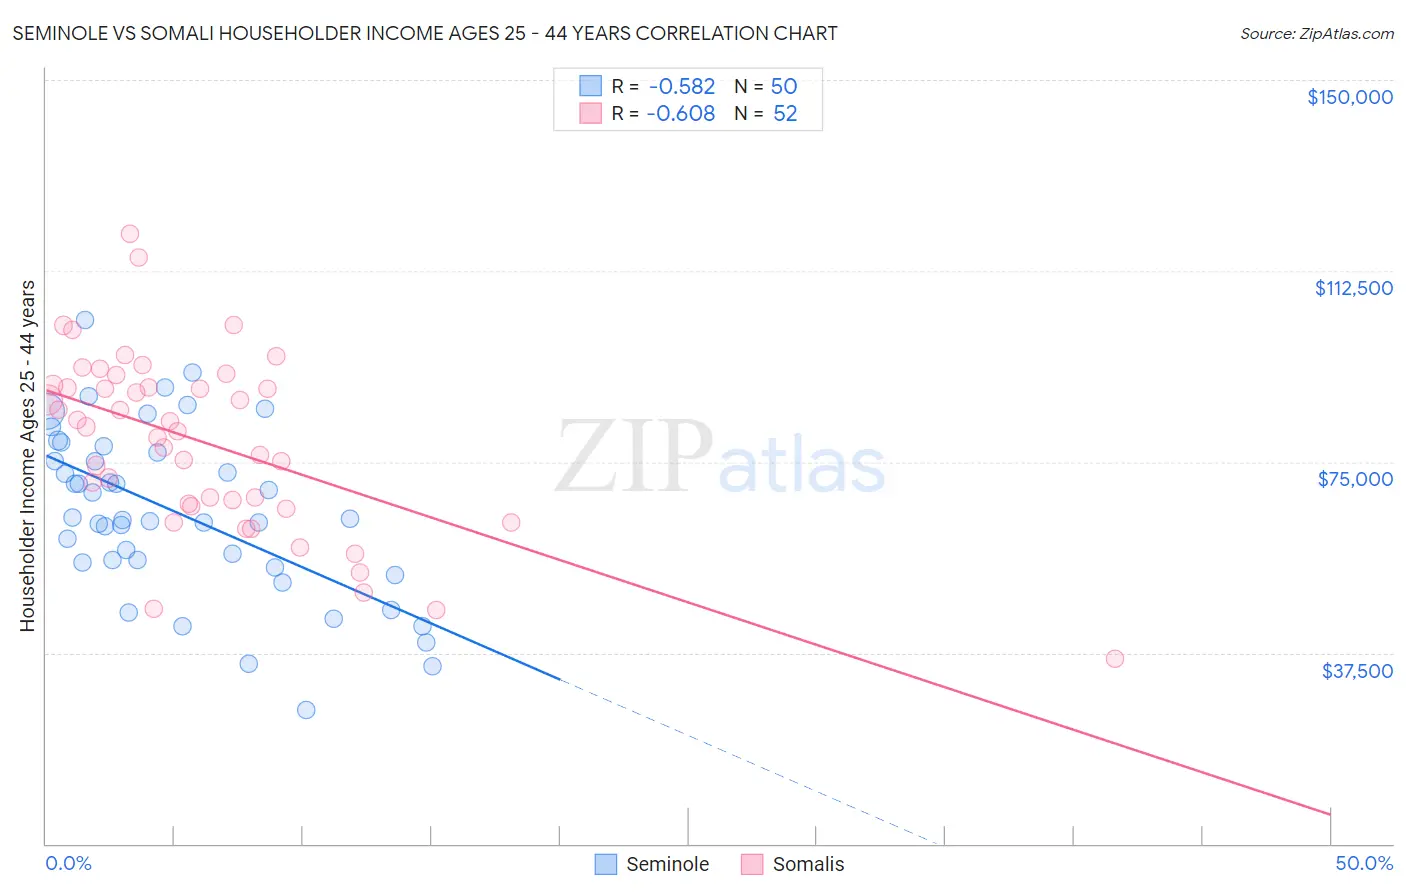
Seminole vs Somali Householder Income Ages 25 - 44 years Correlation Chart
The statistical analysis conducted on geographies consisting of 118,219,857 people shows a substantial negative correlation between the proportion of Seminole and household income with householder between the ages 25 and 44 in the United States with a correlation coefficient (R) of -0.582 and weighted average of $76,584. Similarly, the statistical analysis conducted on geographies consisting of 99,259,991 people shows a significant negative correlation between the proportion of Somalis and household income with householder between the ages 25 and 44 in the United States with a correlation coefficient (R) of -0.608 and weighted average of $83,752, a difference of 9.4%.
Householder Income Ages 25 - 44 years Correlation Summary
| Measurement | Seminole | Somali |
| Minimum | $26,250 | $36,409 |
| Maximum | $102,754 | $119,737 |
| Range | $76,504 | $83,328 |
| Mean | $65,024 | $78,789 |
| Median | $63,631 | $81,501 |
| Interquartile 25% (IQ1) | $55,292 | $66,569 |
| Interquartile 75% (IQ3) | $76,875 | $89,819 |
| Interquartile Range (IQR) | $21,583 | $23,250 |
| Standard Deviation (Sample) | $16,561 | $17,508 |
| Standard Deviation (Population) | $16,395 | $17,339 |
Similar Demographics by Householder Income Ages 25 - 44 years
Demographics Similar to Seminole by Householder Income Ages 25 - 44 years
In terms of householder income ages 25 - 44 years, the demographic groups most similar to Seminole are Immigrants from Cuba ($76,701, a difference of 0.15%), Immigrants from Bahamas ($76,910, a difference of 0.42%), Yakama ($76,226, a difference of 0.47%), Houma ($77,044, a difference of 0.60%), and Sioux ($77,089, a difference of 0.66%).
| Demographics | Rating | Rank | Householder Income Ages 25 - 44 years |
| Chickasaw | 0.0 /100 | #322 | Tragic $77,929 |
| Immigrants | Honduras | 0.0 /100 | #323 | Tragic $77,328 |
| Dutch West Indians | 0.0 /100 | #324 | Tragic $77,260 |
| Sioux | 0.0 /100 | #325 | Tragic $77,089 |
| Houma | 0.0 /100 | #326 | Tragic $77,044 |
| Immigrants | Bahamas | 0.0 /100 | #327 | Tragic $76,910 |
| Immigrants | Cuba | 0.0 /100 | #328 | Tragic $76,701 |
| Seminole | 0.0 /100 | #329 | Tragic $76,584 |
| Yakama | 0.0 /100 | #330 | Tragic $76,226 |
| Natives/Alaskans | 0.0 /100 | #331 | Tragic $75,647 |
| Bahamians | 0.0 /100 | #332 | Tragic $75,395 |
| Hopi | 0.0 /100 | #333 | Tragic $75,002 |
| Creek | 0.0 /100 | #334 | Tragic $74,847 |
| Kiowa | 0.0 /100 | #335 | Tragic $74,776 |
| Yup'ik | 0.0 /100 | #336 | Tragic $73,688 |
Demographics Similar to Somalis by Householder Income Ages 25 - 44 years
In terms of householder income ages 25 - 44 years, the demographic groups most similar to Somalis are Spanish American ($83,722, a difference of 0.040%), Iroquois ($83,682, a difference of 0.080%), Marshallese ($83,575, a difference of 0.21%), Jamaican ($83,933, a difference of 0.22%), and Spanish American Indian ($84,085, a difference of 0.40%).
| Demographics | Rating | Rank | Householder Income Ages 25 - 44 years |
| Osage | 0.4 /100 | #264 | Tragic $84,461 |
| Sudanese | 0.4 /100 | #265 | Tragic $84,401 |
| Immigrants | Cabo Verde | 0.3 /100 | #266 | Tragic $84,304 |
| Hmong | 0.3 /100 | #267 | Tragic $84,258 |
| Sub-Saharan Africans | 0.3 /100 | #268 | Tragic $84,235 |
| Spanish American Indians | 0.3 /100 | #269 | Tragic $84,085 |
| Jamaicans | 0.3 /100 | #270 | Tragic $83,933 |
| Somalis | 0.2 /100 | #271 | Tragic $83,752 |
| Spanish Americans | 0.2 /100 | #272 | Tragic $83,722 |
| Iroquois | 0.2 /100 | #273 | Tragic $83,682 |
| Marshallese | 0.2 /100 | #274 | Tragic $83,575 |
| Immigrants | Jamaica | 0.2 /100 | #275 | Tragic $83,298 |
| Immigrants | Belize | 0.2 /100 | #276 | Tragic $83,141 |
| Paiute | 0.2 /100 | #277 | Tragic $82,984 |
| Senegalese | 0.2 /100 | #278 | Tragic $82,852 |