New Zealander vs Immigrants from Lebanon Householder Income Ages 25 - 44 years
COMPARE
New Zealander
Immigrants from Lebanon
Householder Income Ages 25 - 44 years
Householder Income Ages 25 - 44 years Comparison
New Zealanders
Immigrants from Lebanon
$105,085
HOUSEHOLDER INCOME AGES 25 - 44 YEARS
99.7/ 100
METRIC RATING
64th/ 347
METRIC RANK
$101,124
HOUSEHOLDER INCOME AGES 25 - 44 YEARS
97.4/ 100
METRIC RATING
102nd/ 347
METRIC RANK
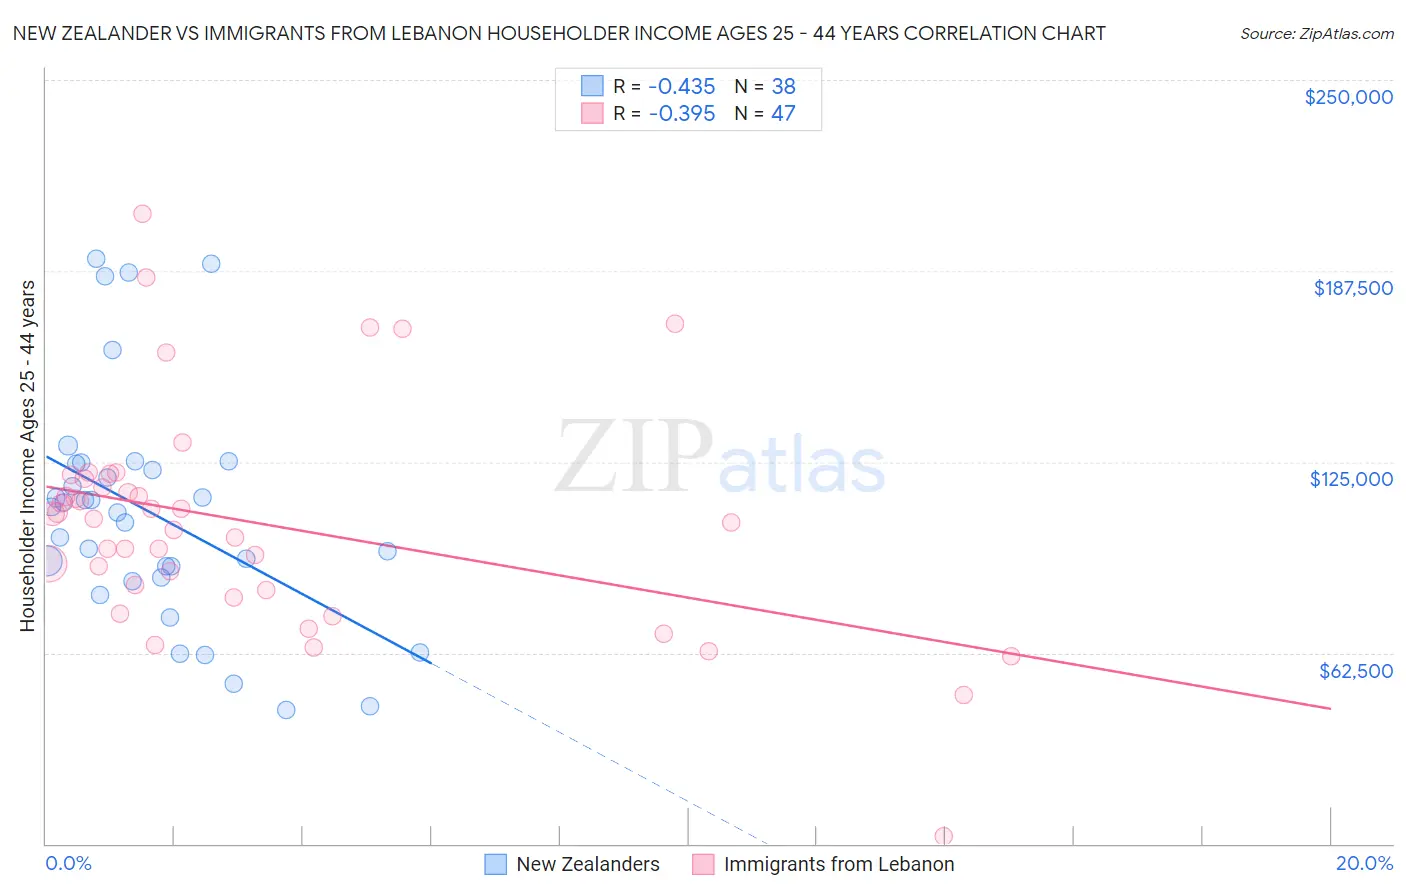
New Zealander vs Immigrants from Lebanon Householder Income Ages 25 - 44 years Correlation Chart
The statistical analysis conducted on geographies consisting of 106,878,711 people shows a moderate negative correlation between the proportion of New Zealanders and household income with householder between the ages 25 and 44 in the United States with a correlation coefficient (R) of -0.435 and weighted average of $105,085. Similarly, the statistical analysis conducted on geographies consisting of 217,010,857 people shows a mild negative correlation between the proportion of Immigrants from Lebanon and household income with householder between the ages 25 and 44 in the United States with a correlation coefficient (R) of -0.395 and weighted average of $101,124, a difference of 3.9%.
Householder Income Ages 25 - 44 years Correlation Summary
| Measurement | New Zealander | Immigrants from Lebanon |
| Minimum | $43,917 | $2,499 |
| Maximum | $191,624 | $206,381 |
| Range | $147,707 | $203,882 |
| Mean | $108,113 | $105,094 |
| Median | $109,281 | $106,198 |
| Interquartile 25% (IQ1) | $87,015 | $82,875 |
| Interquartile 75% (IQ3) | $124,339 | $119,653 |
| Interquartile Range (IQR) | $37,324 | $36,778 |
| Standard Deviation (Sample) | $37,737 | $36,794 |
| Standard Deviation (Population) | $37,238 | $36,401 |
Similar Demographics by Householder Income Ages 25 - 44 years
Demographics Similar to New Zealanders by Householder Income Ages 25 - 44 years
In terms of householder income ages 25 - 44 years, the demographic groups most similar to New Zealanders are Immigrants from Scotland ($105,089, a difference of 0.0%), Immigrants from Netherlands ($105,082, a difference of 0.0%), Laotian ($104,993, a difference of 0.090%), Immigrants from Italy ($105,201, a difference of 0.11%), and Lithuanian ($105,223, a difference of 0.13%).
| Demographics | Rating | Rank | Householder Income Ages 25 - 44 years |
| Immigrants | Austria | 99.8 /100 | #57 | Exceptional $106,103 |
| Immigrants | South Africa | 99.8 /100 | #58 | Exceptional $105,748 |
| Immigrants | Latvia | 99.8 /100 | #59 | Exceptional $105,522 |
| Egyptians | 99.7 /100 | #60 | Exceptional $105,282 |
| Lithuanians | 99.7 /100 | #61 | Exceptional $105,223 |
| Immigrants | Italy | 99.7 /100 | #62 | Exceptional $105,201 |
| Immigrants | Scotland | 99.7 /100 | #63 | Exceptional $105,089 |
| New Zealanders | 99.7 /100 | #64 | Exceptional $105,085 |
| Immigrants | Netherlands | 99.7 /100 | #65 | Exceptional $105,082 |
| Laotians | 99.7 /100 | #66 | Exceptional $104,993 |
| Immigrants | Romania | 99.6 /100 | #67 | Exceptional $104,713 |
| Immigrants | Eastern Europe | 99.6 /100 | #68 | Exceptional $104,662 |
| Mongolians | 99.6 /100 | #69 | Exceptional $104,578 |
| Immigrants | Croatia | 99.6 /100 | #70 | Exceptional $104,503 |
| Afghans | 99.6 /100 | #71 | Exceptional $104,410 |
Demographics Similar to Immigrants from Lebanon by Householder Income Ages 25 - 44 years
In terms of householder income ages 25 - 44 years, the demographic groups most similar to Immigrants from Lebanon are Immigrants from Moldova ($101,091, a difference of 0.030%), Immigrants from Poland ($101,065, a difference of 0.060%), Albanian ($101,367, a difference of 0.24%), Immigrants from Argentina ($101,415, a difference of 0.29%), and Taiwanese ($101,492, a difference of 0.36%).
| Demographics | Rating | Rank | Householder Income Ages 25 - 44 years |
| Assyrians/Chaldeans/Syriacs | 98.3 /100 | #95 | Exceptional $101,936 |
| Macedonians | 98.3 /100 | #96 | Exceptional $101,882 |
| Austrians | 98.3 /100 | #97 | Exceptional $101,842 |
| Immigrants | Kazakhstan | 98.1 /100 | #98 | Exceptional $101,727 |
| Taiwanese | 97.9 /100 | #99 | Exceptional $101,492 |
| Immigrants | Argentina | 97.8 /100 | #100 | Exceptional $101,415 |
| Albanians | 97.8 /100 | #101 | Exceptional $101,367 |
| Immigrants | Lebanon | 97.4 /100 | #102 | Exceptional $101,124 |
| Immigrants | Moldova | 97.4 /100 | #103 | Exceptional $101,091 |
| Immigrants | Poland | 97.4 /100 | #104 | Exceptional $101,065 |
| Immigrants | Vietnam | 96.5 /100 | #105 | Exceptional $100,535 |
| Immigrants | Brazil | 96.5 /100 | #106 | Exceptional $100,534 |
| Northern Europeans | 96.3 /100 | #107 | Exceptional $100,457 |
| Immigrants | South Eastern Asia | 96.0 /100 | #108 | Exceptional $100,283 |
| Immigrants | North Macedonia | 95.6 /100 | #109 | Exceptional $100,101 |