Immigrants vs Pima Householder Income Under 25 years
COMPARE
Immigrants
Pima
Householder Income Under 25 years
Householder Income Under 25 years Comparison
Immigrants
Pima
$53,201
HOUSEHOLDER INCOME UNDER 25 YEARS
92.2/ 100
METRIC RATING
133rd/ 347
METRIC RANK
$51,503
HOUSEHOLDER INCOME UNDER 25 YEARS
15.7/ 100
METRIC RATING
197th/ 347
METRIC RANK
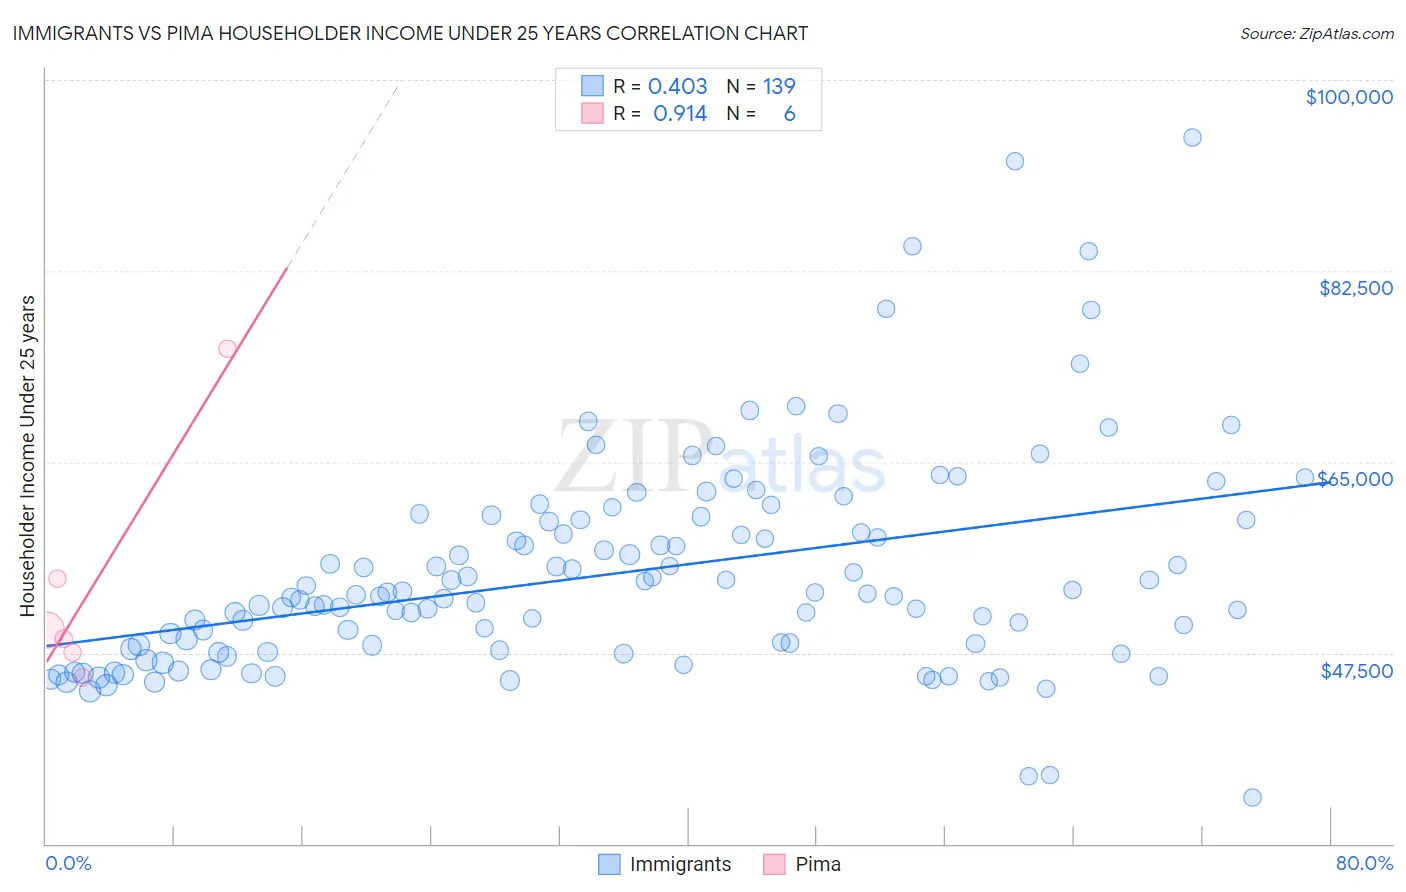
Immigrants vs Pima Householder Income Under 25 years Correlation Chart
The statistical analysis conducted on geographies consisting of 440,888,277 people shows a moderate positive correlation between the proportion of Immigrants and household income with householder under the age of 25 in the United States with a correlation coefficient (R) of 0.403 and weighted average of $53,201. Similarly, the statistical analysis conducted on geographies consisting of 59,375,997 people shows a near-perfect positive correlation between the proportion of Pima and household income with householder under the age of 25 in the United States with a correlation coefficient (R) of 0.914 and weighted average of $51,503, a difference of 3.3%.
Householder Income Under 25 years Correlation Summary
| Measurement | Immigrants | Pima |
| Minimum | $34,271 | $45,215 |
| Maximum | $94,688 | $75,313 |
| Range | $60,417 | $30,098 |
| Mean | $54,792 | $53,455 |
| Median | $52,736 | $49,199 |
| Interquartile 25% (IQ1) | $47,750 | $47,558 |
| Interquartile 75% (IQ3) | $59,631 | $54,244 |
| Interquartile Range (IQR) | $11,881 | $6,685 |
| Standard Deviation (Sample) | $9,932 | $11,115 |
| Standard Deviation (Population) | $9,896 | $10,146 |
Similar Demographics by Householder Income Under 25 years
Demographics Similar to Immigrants by Householder Income Under 25 years
In terms of householder income under 25 years, the demographic groups most similar to Immigrants are Immigrants from Northern Africa ($53,185, a difference of 0.030%), Chilean ($53,185, a difference of 0.030%), Armenian ($53,179, a difference of 0.040%), Immigrants from Barbados ($53,163, a difference of 0.070%), and Moroccan ($53,256, a difference of 0.10%).
| Demographics | Rating | Rank | Householder Income Under 25 years |
| Immigrants | Serbia | 94.1 /100 | #126 | Exceptional $53,321 |
| Immigrants | North America | 93.9 /100 | #127 | Exceptional $53,307 |
| Immigrants | Bulgaria | 93.9 /100 | #128 | Exceptional $53,305 |
| New Zealanders | 93.7 /100 | #129 | Exceptional $53,294 |
| Nicaraguans | 93.4 /100 | #130 | Exceptional $53,275 |
| Immigrants | Nicaragua | 93.3 /100 | #131 | Exceptional $53,266 |
| Moroccans | 93.1 /100 | #132 | Exceptional $53,256 |
| Immigrants | Immigrants | 92.2 /100 | #133 | Exceptional $53,201 |
| Immigrants | Northern Africa | 91.9 /100 | #134 | Exceptional $53,185 |
| Chileans | 91.9 /100 | #135 | Exceptional $53,185 |
| Armenians | 91.8 /100 | #136 | Exceptional $53,179 |
| Immigrants | Barbados | 91.5 /100 | #137 | Exceptional $53,163 |
| Norwegians | 90.8 /100 | #138 | Exceptional $53,127 |
| Costa Ricans | 90.4 /100 | #139 | Exceptional $53,106 |
| Hawaiians | 89.8 /100 | #140 | Excellent $53,078 |
Demographics Similar to Pima by Householder Income Under 25 years
In terms of householder income under 25 years, the demographic groups most similar to Pima are Palestinian ($51,515, a difference of 0.020%), Immigrants from Syria ($51,494, a difference of 0.020%), Swiss ($51,493, a difference of 0.020%), Guatemalan ($51,525, a difference of 0.040%), and Estonian ($51,523, a difference of 0.040%).
| Demographics | Rating | Rank | Householder Income Under 25 years |
| Malaysians | 19.7 /100 | #190 | Poor $51,615 |
| Panamanians | 19.5 /100 | #191 | Poor $51,611 |
| West Indians | 18.5 /100 | #192 | Poor $51,583 |
| Immigrants | Eritrea | 18.1 /100 | #193 | Poor $51,574 |
| Guatemalans | 16.4 /100 | #194 | Poor $51,525 |
| Estonians | 16.4 /100 | #195 | Poor $51,523 |
| Palestinians | 16.1 /100 | #196 | Poor $51,515 |
| Pima | 15.7 /100 | #197 | Poor $51,503 |
| Immigrants | Syria | 15.4 /100 | #198 | Poor $51,494 |
| Swiss | 15.4 /100 | #199 | Poor $51,493 |
| Immigrants | West Indies | 14.9 /100 | #200 | Poor $51,479 |
| British | 14.9 /100 | #201 | Poor $51,477 |
| Immigrants | Guatemala | 14.0 /100 | #202 | Poor $51,447 |
| Immigrants | Cameroon | 13.6 /100 | #203 | Poor $51,433 |
| Czechs | 13.2 /100 | #204 | Poor $51,421 |