Immigrants from Grenada vs Slovak Median Earnings
COMPARE
Immigrants from Grenada
Slovak
Median Earnings
Median Earnings Comparison
Immigrants from Grenada
Slovaks
$45,596
MEDIAN EARNINGS
23.6/ 100
METRIC RATING
210th/ 347
METRIC RANK
$47,095
MEDIAN EARNINGS
71.7/ 100
METRIC RATING
158th/ 347
METRIC RANK
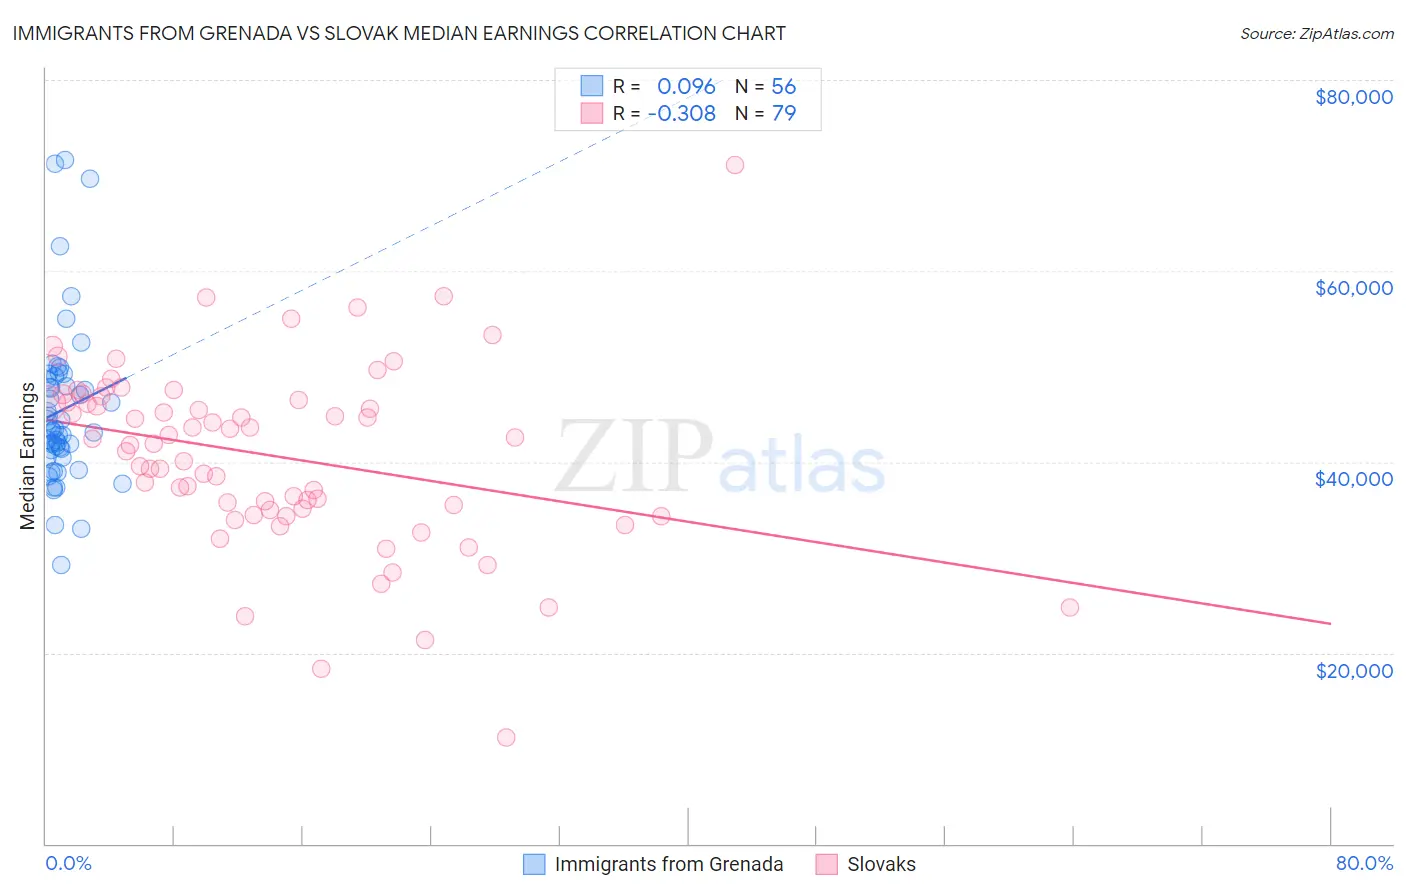
Immigrants from Grenada vs Slovak Median Earnings Correlation Chart
The statistical analysis conducted on geographies consisting of 67,199,447 people shows a slight positive correlation between the proportion of Immigrants from Grenada and median earnings in the United States with a correlation coefficient (R) of 0.096 and weighted average of $45,596. Similarly, the statistical analysis conducted on geographies consisting of 397,848,187 people shows a mild negative correlation between the proportion of Slovaks and median earnings in the United States with a correlation coefficient (R) of -0.308 and weighted average of $47,095, a difference of 3.3%.
Median Earnings Correlation Summary
| Measurement | Immigrants from Grenada | Slovak |
| Minimum | $29,237 | $11,076 |
| Maximum | $71,671 | $71,150 |
| Range | $42,434 | $60,074 |
| Mean | $45,405 | $40,661 |
| Median | $43,368 | $41,901 |
| Interquartile 25% (IQ1) | $40,879 | $35,020 |
| Interquartile 75% (IQ3) | $48,789 | $46,429 |
| Interquartile Range (IQR) | $7,911 | $11,409 |
| Standard Deviation (Sample) | $8,458 | $9,606 |
| Standard Deviation (Population) | $8,382 | $9,545 |
Similar Demographics by Median Earnings
Demographics Similar to Immigrants from Grenada by Median Earnings
In terms of median earnings, the demographic groups most similar to Immigrants from Grenada are Immigrants from Thailand ($45,598, a difference of 0.0%), Immigrants from Bosnia and Herzegovina ($45,600, a difference of 0.010%), Panamanian ($45,593, a difference of 0.010%), Bermudan ($45,593, a difference of 0.010%), and Immigrants from Senegal ($45,611, a difference of 0.030%).
| Demographics | Rating | Rank | Median Earnings |
| Welsh | 26.6 /100 | #203 | Fair $45,710 |
| Immigrants | Uruguay | 25.9 /100 | #204 | Fair $45,682 |
| Tongans | 25.4 /100 | #205 | Fair $45,665 |
| Immigrants | Ghana | 24.8 /100 | #206 | Fair $45,641 |
| Immigrants | Senegal | 24.0 /100 | #207 | Fair $45,611 |
| Immigrants | Bosnia and Herzegovina | 23.7 /100 | #208 | Fair $45,600 |
| Immigrants | Thailand | 23.7 /100 | #209 | Fair $45,598 |
| Immigrants | Grenada | 23.6 /100 | #210 | Fair $45,596 |
| Panamanians | 23.5 /100 | #211 | Fair $45,593 |
| Bermudans | 23.5 /100 | #212 | Fair $45,593 |
| Immigrants | Colombia | 22.4 /100 | #213 | Fair $45,550 |
| Nigerians | 22.0 /100 | #214 | Fair $45,532 |
| Immigrants | Bangladesh | 22.0 /100 | #215 | Fair $45,532 |
| Guyanese | 20.6 /100 | #216 | Fair $45,470 |
| Tlingit-Haida | 20.5 /100 | #217 | Fair $45,468 |
Demographics Similar to Slovaks by Median Earnings
In terms of median earnings, the demographic groups most similar to Slovaks are Immigrants from Peru ($47,025, a difference of 0.15%), Alsatian ($47,023, a difference of 0.15%), Czech ($47,221, a difference of 0.27%), Immigrants from Eastern Africa ($46,969, a difference of 0.27%), and South American Indian ($46,952, a difference of 0.31%).
| Demographics | Rating | Rank | Median Earnings |
| Immigrants | Oceania | 84.1 /100 | #151 | Excellent $47,617 |
| Immigrants | Germany | 83.1 /100 | #152 | Excellent $47,566 |
| Slavs | 81.1 /100 | #153 | Excellent $47,470 |
| Immigrants | Portugal | 77.3 /100 | #154 | Good $47,304 |
| Immigrants | Vietnam | 76.7 /100 | #155 | Good $47,282 |
| Irish | 76.6 /100 | #156 | Good $47,276 |
| Czechs | 75.1 /100 | #157 | Good $47,221 |
| Slovaks | 71.7 /100 | #158 | Good $47,095 |
| Immigrants | Peru | 69.6 /100 | #159 | Good $47,025 |
| Alsatians | 69.6 /100 | #160 | Good $47,023 |
| Immigrants | Eastern Africa | 68.0 /100 | #161 | Good $46,969 |
| South American Indians | 67.4 /100 | #162 | Good $46,952 |
| Icelanders | 66.3 /100 | #163 | Good $46,916 |
| Norwegians | 64.7 /100 | #164 | Good $46,865 |
| South Americans | 62.7 /100 | #165 | Good $46,804 |