Czechoslovakian vs German Russian Median Earnings
COMPARE
Czechoslovakian
German Russian
Median Earnings
Median Earnings Comparison
Czechoslovakians
German Russians
$46,658
MEDIAN EARNINGS
57.8/ 100
METRIC RATING
166th/ 347
METRIC RANK
$43,200
MEDIAN EARNINGS
1.1/ 100
METRIC RATING
259th/ 347
METRIC RANK
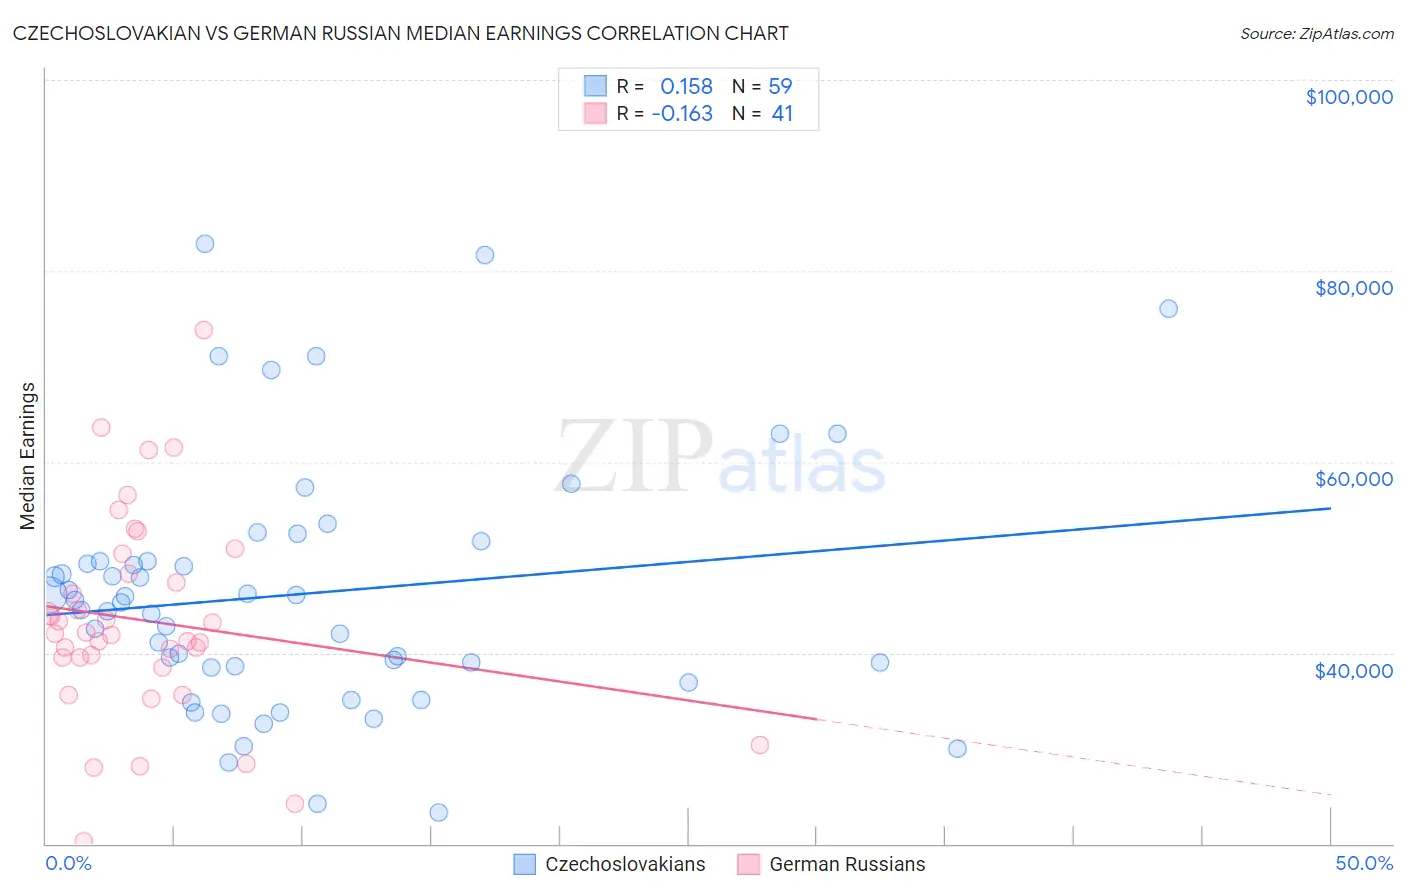
Czechoslovakian vs German Russian Median Earnings Correlation Chart
The statistical analysis conducted on geographies consisting of 368,633,648 people shows a poor positive correlation between the proportion of Czechoslovakians and median earnings in the United States with a correlation coefficient (R) of 0.158 and weighted average of $46,658. Similarly, the statistical analysis conducted on geographies consisting of 96,461,266 people shows a poor negative correlation between the proportion of German Russians and median earnings in the United States with a correlation coefficient (R) of -0.163 and weighted average of $43,200, a difference of 8.0%.
Median Earnings Correlation Summary
| Measurement | Czechoslovakian | German Russian |
| Minimum | $23,333 | $20,324 |
| Maximum | $82,793 | $73,750 |
| Range | $59,460 | $53,426 |
| Mean | $46,151 | $43,344 |
| Median | $45,298 | $42,036 |
| Interquartile 25% (IQ1) | $38,524 | $38,952 |
| Interquartile 75% (IQ3) | $49,625 | $49,348 |
| Interquartile Range (IQR) | $11,101 | $10,396 |
| Standard Deviation (Sample) | $13,082 | $10,822 |
| Standard Deviation (Population) | $12,971 | $10,689 |
Similar Demographics by Median Earnings
Demographics Similar to Czechoslovakians by Median Earnings
In terms of median earnings, the demographic groups most similar to Czechoslovakians are Costa Rican ($46,645, a difference of 0.030%), Immigrants from Africa ($46,564, a difference of 0.20%), Immigrants from South America ($46,548, a difference of 0.24%), South American ($46,804, a difference of 0.31%), and Immigrants ($46,478, a difference of 0.39%).
| Demographics | Rating | Rank | Median Earnings |
| Immigrants | Peru | 69.6 /100 | #159 | Good $47,025 |
| Alsatians | 69.6 /100 | #160 | Good $47,023 |
| Immigrants | Eastern Africa | 68.0 /100 | #161 | Good $46,969 |
| South American Indians | 67.4 /100 | #162 | Good $46,952 |
| Icelanders | 66.3 /100 | #163 | Good $46,916 |
| Norwegians | 64.7 /100 | #164 | Good $46,865 |
| South Americans | 62.7 /100 | #165 | Good $46,804 |
| Czechoslovakians | 57.8 /100 | #166 | Average $46,658 |
| Costa Ricans | 57.4 /100 | #167 | Average $46,645 |
| Immigrants | Africa | 54.6 /100 | #168 | Average $46,564 |
| Immigrants | South America | 54.0 /100 | #169 | Average $46,548 |
| Immigrants | Immigrants | 51.6 /100 | #170 | Average $46,478 |
| Scottish | 51.1 /100 | #171 | Average $46,463 |
| Kenyans | 51.0 /100 | #172 | Average $46,462 |
| Ghanaians | 50.3 /100 | #173 | Average $46,440 |
Demographics Similar to German Russians by Median Earnings
In terms of median earnings, the demographic groups most similar to German Russians are Immigrants from Somalia ($43,100, a difference of 0.23%), French American Indian ($43,333, a difference of 0.31%), Jamaican ($43,343, a difference of 0.33%), Immigrants from Jamaica ($43,026, a difference of 0.40%), and Nicaraguan ($43,026, a difference of 0.40%).
| Demographics | Rating | Rank | Median Earnings |
| Hawaiians | 2.0 /100 | #252 | Tragic $43,673 |
| Somalis | 1.8 /100 | #253 | Tragic $43,567 |
| Liberians | 1.7 /100 | #254 | Tragic $43,536 |
| Immigrants | Middle Africa | 1.4 /100 | #255 | Tragic $43,416 |
| Alaskan Athabascans | 1.4 /100 | #256 | Tragic $43,393 |
| Jamaicans | 1.3 /100 | #257 | Tragic $43,343 |
| French American Indians | 1.3 /100 | #258 | Tragic $43,333 |
| German Russians | 1.1 /100 | #259 | Tragic $43,200 |
| Immigrants | Somalia | 0.9 /100 | #260 | Tragic $43,100 |
| Immigrants | Jamaica | 0.8 /100 | #261 | Tragic $43,026 |
| Nicaraguans | 0.8 /100 | #262 | Tragic $43,026 |
| Inupiat | 0.8 /100 | #263 | Tragic $43,000 |
| Immigrants | Liberia | 0.7 /100 | #264 | Tragic $42,923 |
| Salvadorans | 0.7 /100 | #265 | Tragic $42,912 |
| Immigrants | Laos | 0.7 /100 | #266 | Tragic $42,884 |