Korean vs French American Indian Per Capita Income
COMPARE
Korean
French American Indian
Per Capita Income
Per Capita Income Comparison
Koreans
French American Indians
$44,522
PER CAPITA INCOME
72.5/ 100
METRIC RATING
149th/ 347
METRIC RANK
$40,244
PER CAPITA INCOME
2.1/ 100
METRIC RATING
244th/ 347
METRIC RANK
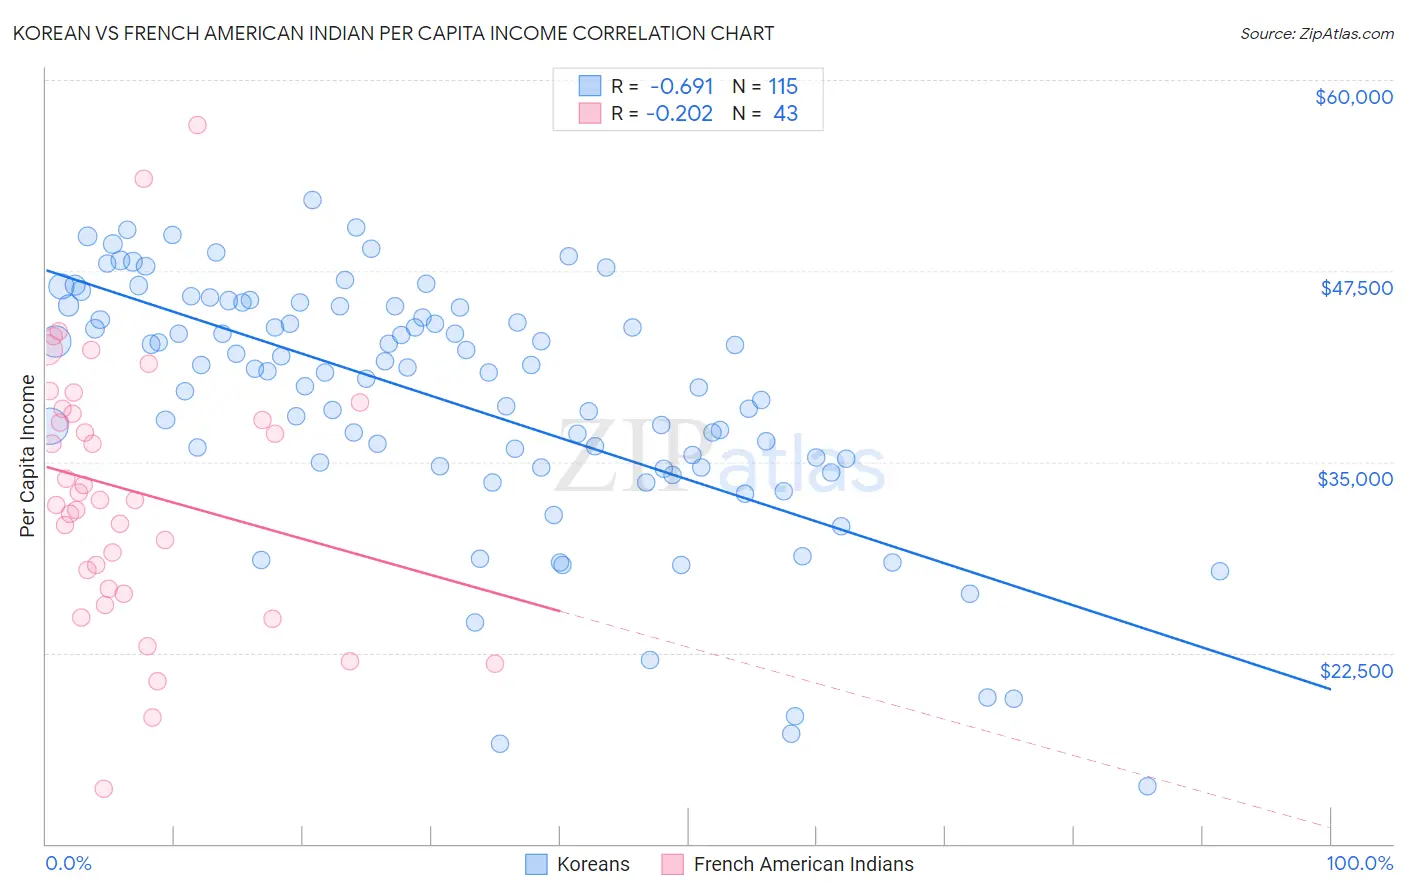
Korean vs French American Indian Per Capita Income Correlation Chart
The statistical analysis conducted on geographies consisting of 510,996,517 people shows a significant negative correlation between the proportion of Koreans and per capita income in the United States with a correlation coefficient (R) of -0.691 and weighted average of $44,522. Similarly, the statistical analysis conducted on geographies consisting of 131,975,147 people shows a weak negative correlation between the proportion of French American Indians and per capita income in the United States with a correlation coefficient (R) of -0.202 and weighted average of $40,244, a difference of 10.6%.
Per Capita Income Correlation Summary
| Measurement | Korean | French American Indian |
| Minimum | $13,802 | $13,560 |
| Maximum | $52,147 | $57,062 |
| Range | $38,345 | $43,502 |
| Mean | $38,981 | $33,133 |
| Median | $40,908 | $32,489 |
| Interquartile 25% (IQ1) | $34,687 | $26,698 |
| Interquartile 75% (IQ3) | $45,181 | $38,474 |
| Interquartile Range (IQR) | $10,494 | $11,776 |
| Standard Deviation (Sample) | $8,123 | $8,715 |
| Standard Deviation (Population) | $8,088 | $8,613 |
Similar Demographics by Per Capita Income
Demographics Similar to Koreans by Per Capita Income
In terms of per capita income, the demographic groups most similar to Koreans are Immigrants from Eritrea ($44,509, a difference of 0.030%), Immigrants from Armenia ($44,552, a difference of 0.070%), Norwegian ($44,480, a difference of 0.10%), Peruvian ($44,479, a difference of 0.10%), and Czech ($44,595, a difference of 0.16%).
| Demographics | Rating | Rank | Per Capita Income |
| Ugandans | 82.6 /100 | #142 | Excellent $45,047 |
| Immigrants | Uganda | 82.5 /100 | #143 | Excellent $45,043 |
| Icelanders | 81.6 /100 | #144 | Excellent $44,987 |
| Immigrants | Afghanistan | 78.0 /100 | #145 | Good $44,790 |
| Irish | 75.8 /100 | #146 | Good $44,679 |
| Czechs | 74.1 /100 | #147 | Good $44,595 |
| Immigrants | Armenia | 73.1 /100 | #148 | Good $44,552 |
| Koreans | 72.5 /100 | #149 | Good $44,522 |
| Immigrants | Eritrea | 72.1 /100 | #150 | Good $44,509 |
| Norwegians | 71.5 /100 | #151 | Good $44,480 |
| Peruvians | 71.5 /100 | #152 | Good $44,479 |
| Scottish | 70.6 /100 | #153 | Good $44,440 |
| Portuguese | 68.7 /100 | #154 | Good $44,362 |
| Uruguayans | 67.6 /100 | #155 | Good $44,318 |
| Slovaks | 65.4 /100 | #156 | Good $44,229 |
Demographics Similar to French American Indians by Per Capita Income
In terms of per capita income, the demographic groups most similar to French American Indians are German Russian ($40,266, a difference of 0.060%), Immigrants from Western Africa ($40,294, a difference of 0.13%), British West Indian ($40,330, a difference of 0.21%), Subsaharan African ($40,152, a difference of 0.23%), and Immigrants from Nigeria ($40,339, a difference of 0.24%).
| Demographics | Rating | Rank | Per Capita Income |
| Immigrants | Cambodia | 2.6 /100 | #237 | Tragic $40,434 |
| Somalis | 2.4 /100 | #238 | Tragic $40,367 |
| Tsimshian | 2.4 /100 | #239 | Tragic $40,344 |
| Immigrants | Nigeria | 2.3 /100 | #240 | Tragic $40,339 |
| British West Indians | 2.3 /100 | #241 | Tragic $40,330 |
| Immigrants | Western Africa | 2.2 /100 | #242 | Tragic $40,294 |
| German Russians | 2.2 /100 | #243 | Tragic $40,266 |
| French American Indians | 2.1 /100 | #244 | Tragic $40,244 |
| Sub-Saharan Africans | 1.9 /100 | #245 | Tragic $40,152 |
| Cree | 1.7 /100 | #246 | Tragic $40,056 |
| Immigrants | Somalia | 1.6 /100 | #247 | Tragic $39,974 |
| Cape Verdeans | 1.5 /100 | #248 | Tragic $39,935 |
| Japanese | 1.4 /100 | #249 | Tragic $39,870 |
| Immigrants | Burma/Myanmar | 1.3 /100 | #250 | Tragic $39,827 |
| Samoans | 1.3 /100 | #251 | Tragic $39,826 |