Mongolian vs Laotian Single Mother Households
COMPARE
Mongolian
Laotian
Single Mother Households
Single Mother Households Comparison
Mongolians
Laotians
5.8%
SINGLE MOTHER HOUSEHOLDS
95.3/ 100
METRIC RATING
113th/ 347
METRIC RANK
5.8%
SINGLE MOTHER HOUSEHOLDS
94.3/ 100
METRIC RATING
118th/ 347
METRIC RANK
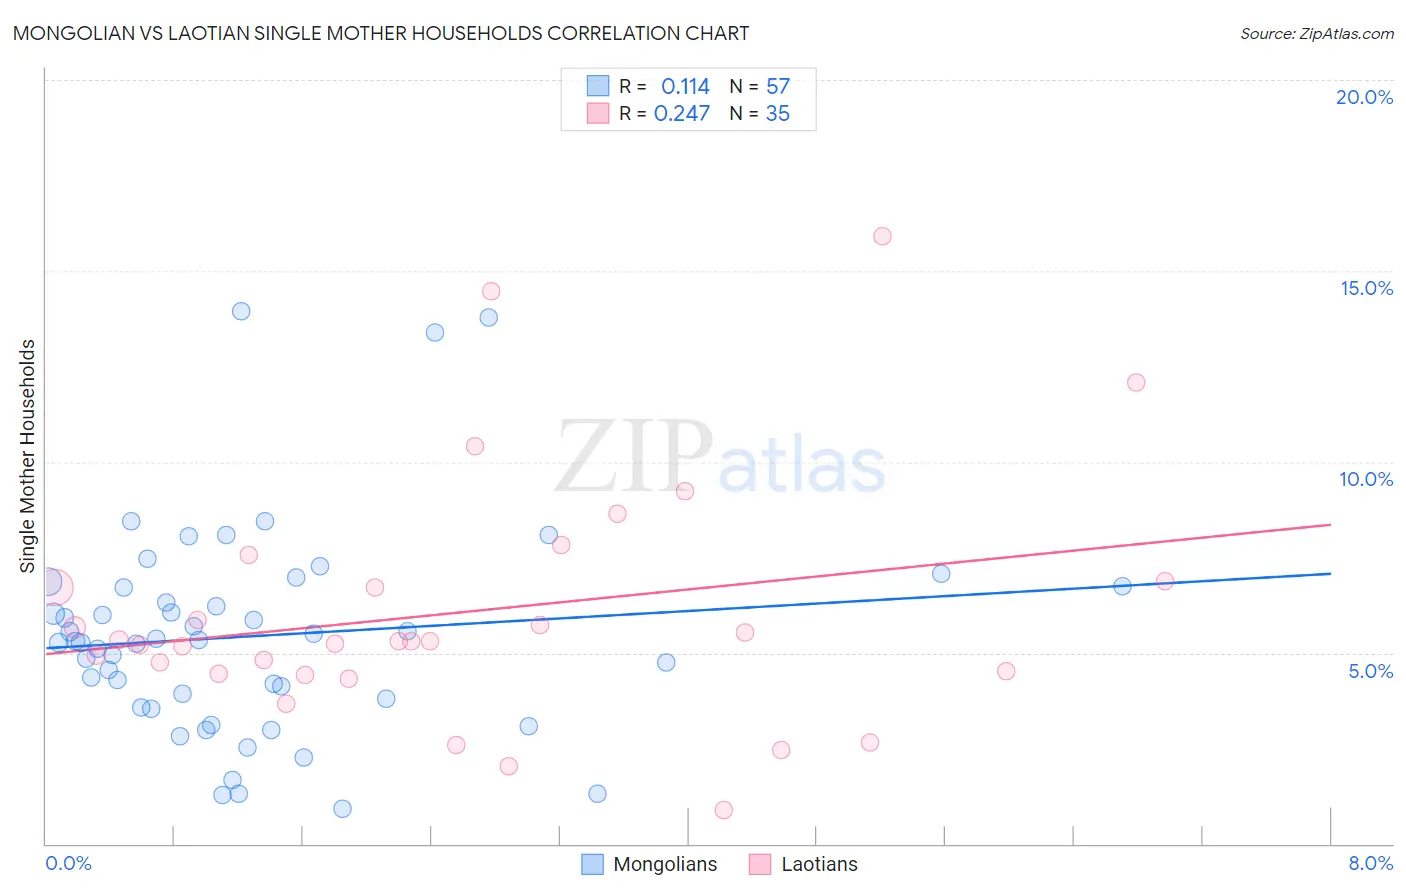
Mongolian vs Laotian Single Mother Households Correlation Chart
The statistical analysis conducted on geographies consisting of 140,225,354 people shows a poor positive correlation between the proportion of Mongolians and percentage of single mother households in the United States with a correlation coefficient (R) of 0.114 and weighted average of 5.8%. Similarly, the statistical analysis conducted on geographies consisting of 224,525,105 people shows a weak positive correlation between the proportion of Laotians and percentage of single mother households in the United States with a correlation coefficient (R) of 0.247 and weighted average of 5.8%, a difference of 0.63%.
Single Mother Households Correlation Summary
| Measurement | Mongolian | Laotian |
| Minimum | 0.92% | 0.87% |
| Maximum | 14.0% | 15.9% |
| Range | 13.0% | 15.0% |
| Mean | 5.4% | 6.1% |
| Median | 5.3% | 5.3% |
| Interquartile 25% (IQ1) | 3.7% | 4.5% |
| Interquartile 75% (IQ3) | 6.7% | 6.9% |
| Interquartile Range (IQR) | 3.0% | 2.4% |
| Standard Deviation (Sample) | 2.7% | 3.2% |
| Standard Deviation (Population) | 2.7% | 3.2% |
Demographics Similar to Mongolians and Laotians by Single Mother Households
In terms of single mother households, the demographic groups most similar to Mongolians are Immigrants from Kuwait (5.8%, a difference of 0.070%), Immigrants from England (5.8%, a difference of 0.11%), Dutch (5.8%, a difference of 0.13%), British (5.8%, a difference of 0.14%), and Immigrants from Western Europe (5.8%, a difference of 0.23%). Similarly, the demographic groups most similar to Laotians are South African (5.8%, a difference of 0.11%), Bolivian (5.8%, a difference of 0.18%), Pennsylvania German (5.8%, a difference of 0.25%), Tongan (5.8%, a difference of 0.30%), and Irish (5.8%, a difference of 0.32%).
| Demographics | Rating | Rank | Single Mother Households |
| Taiwanese | 96.1 /100 | #105 | Exceptional 5.8% |
| Immigrants | Ukraine | 95.9 /100 | #106 | Exceptional 5.8% |
| Paraguayans | 95.8 /100 | #107 | Exceptional 5.8% |
| Immigrants | Italy | 95.8 /100 | #108 | Exceptional 5.8% |
| Immigrants | Western Europe | 95.7 /100 | #109 | Exceptional 5.8% |
| British | 95.5 /100 | #110 | Exceptional 5.8% |
| Immigrants | England | 95.5 /100 | #111 | Exceptional 5.8% |
| Immigrants | Kuwait | 95.4 /100 | #112 | Exceptional 5.8% |
| Mongolians | 95.3 /100 | #113 | Exceptional 5.8% |
| Dutch | 95.1 /100 | #114 | Exceptional 5.8% |
| Irish | 94.8 /100 | #115 | Exceptional 5.8% |
| Pennsylvania Germans | 94.7 /100 | #116 | Exceptional 5.8% |
| Bolivians | 94.6 /100 | #117 | Exceptional 5.8% |
| Laotians | 94.3 /100 | #118 | Exceptional 5.8% |
| South Africans | 94.1 /100 | #119 | Exceptional 5.8% |
| Tongans | 93.7 /100 | #120 | Exceptional 5.8% |
| Argentineans | 93.7 /100 | #121 | Exceptional 5.8% |
| Belgians | 93.5 /100 | #122 | Exceptional 5.8% |
| Immigrants | Uzbekistan | 93.4 /100 | #123 | Exceptional 5.9% |
| Immigrants | Argentina | 93.2 /100 | #124 | Exceptional 5.9% |
| Slavs | 92.9 /100 | #125 | Exceptional 5.9% |