Mongolian vs Samoan Householder Income Ages 25 - 44 years
COMPARE
Mongolian
Samoan
Householder Income Ages 25 - 44 years
Householder Income Ages 25 - 44 years Comparison
Mongolians
Samoans
$104,578
HOUSEHOLDER INCOME AGES 25 - 44 YEARS
99.6/ 100
METRIC RATING
69th/ 347
METRIC RANK
$92,385
HOUSEHOLDER INCOME AGES 25 - 44 YEARS
23.0/ 100
METRIC RATING
193rd/ 347
METRIC RANK
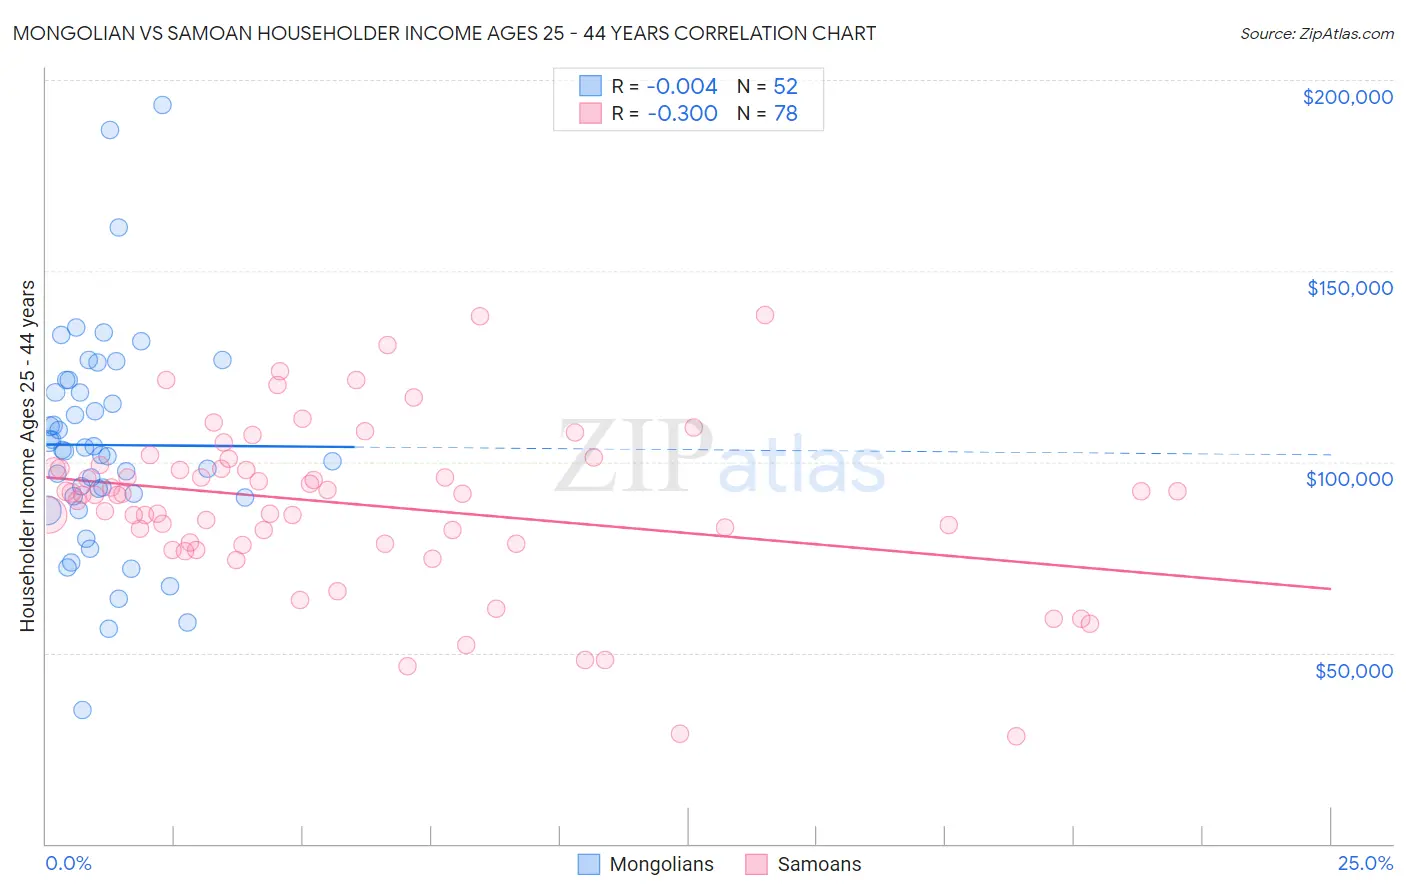
Mongolian vs Samoan Householder Income Ages 25 - 44 years Correlation Chart
The statistical analysis conducted on geographies consisting of 140,220,611 people shows no correlation between the proportion of Mongolians and household income with householder between the ages 25 and 44 in the United States with a correlation coefficient (R) of -0.004 and weighted average of $104,578. Similarly, the statistical analysis conducted on geographies consisting of 224,893,183 people shows a mild negative correlation between the proportion of Samoans and household income with householder between the ages 25 and 44 in the United States with a correlation coefficient (R) of -0.300 and weighted average of $92,385, a difference of 13.2%.
Householder Income Ages 25 - 44 years Correlation Summary
| Measurement | Mongolian | Samoan |
| Minimum | $34,868 | $28,250 |
| Maximum | $193,482 | $138,313 |
| Range | $158,614 | $110,063 |
| Mean | $104,434 | $88,852 |
| Median | $103,048 | $91,500 |
| Interquartile 25% (IQ1) | $90,782 | $78,594 |
| Interquartile 75% (IQ3) | $119,894 | $98,319 |
| Interquartile Range (IQR) | $29,113 | $19,725 |
| Standard Deviation (Sample) | $29,028 | $21,577 |
| Standard Deviation (Population) | $28,748 | $21,438 |
Similar Demographics by Householder Income Ages 25 - 44 years
Demographics Similar to Mongolians by Householder Income Ages 25 - 44 years
In terms of householder income ages 25 - 44 years, the demographic groups most similar to Mongolians are Immigrants from Croatia ($104,503, a difference of 0.070%), Immigrants from Eastern Europe ($104,662, a difference of 0.080%), Immigrants from Romania ($104,713, a difference of 0.13%), Afghan ($104,410, a difference of 0.16%), and Chinese ($104,264, a difference of 0.30%).
| Demographics | Rating | Rank | Householder Income Ages 25 - 44 years |
| Immigrants | Italy | 99.7 /100 | #62 | Exceptional $105,201 |
| Immigrants | Scotland | 99.7 /100 | #63 | Exceptional $105,089 |
| New Zealanders | 99.7 /100 | #64 | Exceptional $105,085 |
| Immigrants | Netherlands | 99.7 /100 | #65 | Exceptional $105,082 |
| Laotians | 99.7 /100 | #66 | Exceptional $104,993 |
| Immigrants | Romania | 99.6 /100 | #67 | Exceptional $104,713 |
| Immigrants | Eastern Europe | 99.6 /100 | #68 | Exceptional $104,662 |
| Mongolians | 99.6 /100 | #69 | Exceptional $104,578 |
| Immigrants | Croatia | 99.6 /100 | #70 | Exceptional $104,503 |
| Afghans | 99.6 /100 | #71 | Exceptional $104,410 |
| Chinese | 99.5 /100 | #72 | Exceptional $104,264 |
| Italians | 99.5 /100 | #73 | Exceptional $104,215 |
| Immigrants | Fiji | 99.5 /100 | #74 | Exceptional $103,954 |
| Koreans | 99.4 /100 | #75 | Exceptional $103,824 |
| Immigrants | Spain | 99.4 /100 | #76 | Exceptional $103,752 |
Demographics Similar to Samoans by Householder Income Ages 25 - 44 years
In terms of householder income ages 25 - 44 years, the demographic groups most similar to Samoans are Immigrants from the Azores ($92,322, a difference of 0.070%), Celtic ($92,241, a difference of 0.16%), Immigrants from Colombia ($92,204, a difference of 0.20%), Spanish ($92,200, a difference of 0.20%), and Vietnamese ($92,089, a difference of 0.32%).
| Demographics | Rating | Rank | Householder Income Ages 25 - 44 years |
| Sierra Leoneans | 34.8 /100 | #186 | Fair $93,435 |
| Spaniards | 34.0 /100 | #187 | Fair $93,366 |
| Immigrants | Sierra Leone | 30.9 /100 | #188 | Fair $93,115 |
| Dutch | 30.5 /100 | #189 | Fair $93,081 |
| Welsh | 30.0 /100 | #190 | Fair $93,039 |
| Tlingit-Haida | 29.4 /100 | #191 | Fair $92,987 |
| Immigrants | Costa Rica | 28.2 /100 | #192 | Fair $92,876 |
| Samoans | 23.0 /100 | #193 | Fair $92,385 |
| Immigrants | Azores | 22.4 /100 | #194 | Fair $92,322 |
| Celtics | 21.6 /100 | #195 | Fair $92,241 |
| Immigrants | Colombia | 21.3 /100 | #196 | Fair $92,204 |
| Spanish | 21.2 /100 | #197 | Fair $92,200 |
| Vietnamese | 20.2 /100 | #198 | Fair $92,089 |
| Kenyans | 16.8 /100 | #199 | Poor $91,684 |
| Whites/Caucasians | 16.7 /100 | #200 | Poor $91,668 |