Immigrants from Germany vs Carpatho Rusyn Median Earnings
COMPARE
Immigrants from Germany
Carpatho Rusyn
Median Earnings
Median Earnings Comparison
Immigrants from Germany
Carpatho Rusyns
$47,566
MEDIAN EARNINGS
83.1/ 100
METRIC RATING
152nd/ 347
METRIC RANK
$48,617
MEDIAN EARNINGS
95.5/ 100
METRIC RATING
120th/ 347
METRIC RANK
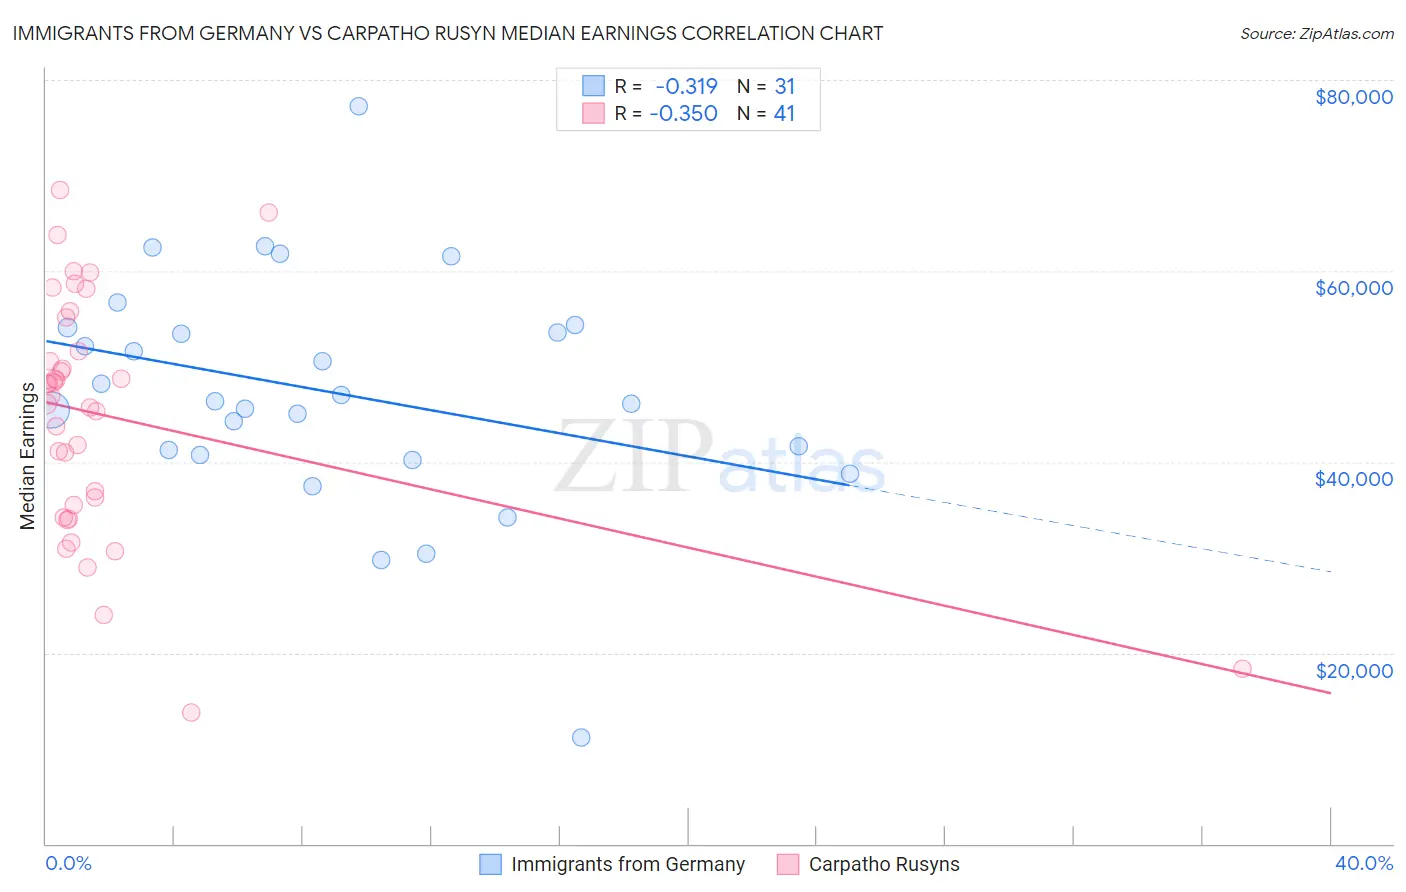
Immigrants from Germany vs Carpatho Rusyn Median Earnings Correlation Chart
The statistical analysis conducted on geographies consisting of 463,817,606 people shows a mild negative correlation between the proportion of Immigrants from Germany and median earnings in the United States with a correlation coefficient (R) of -0.319 and weighted average of $47,566. Similarly, the statistical analysis conducted on geographies consisting of 58,866,831 people shows a mild negative correlation between the proportion of Carpatho Rusyns and median earnings in the United States with a correlation coefficient (R) of -0.350 and weighted average of $48,617, a difference of 2.2%.
Median Earnings Correlation Summary
| Measurement | Immigrants from Germany | Carpatho Rusyn |
| Minimum | $11,184 | $13,750 |
| Maximum | $77,202 | $68,541 |
| Range | $66,018 | $54,791 |
| Mean | $47,273 | $44,793 |
| Median | $46,327 | $46,820 |
| Interquartile 25% (IQ1) | $40,729 | $34,839 |
| Interquartile 75% (IQ3) | $54,030 | $53,317 |
| Interquartile Range (IQR) | $13,301 | $18,479 |
| Standard Deviation (Sample) | $12,257 | $12,606 |
| Standard Deviation (Population) | $12,057 | $12,452 |
Similar Demographics by Median Earnings
Demographics Similar to Immigrants from Germany by Median Earnings
In terms of median earnings, the demographic groups most similar to Immigrants from Germany are Immigrants from Oceania ($47,617, a difference of 0.11%), Peruvian ($47,628, a difference of 0.13%), Luxembourger ($47,640, a difference of 0.16%), Immigrants from Eritrea ($47,657, a difference of 0.19%), and Slavic ($47,470, a difference of 0.20%).
| Demographics | Rating | Rank | Median Earnings |
| Immigrants | Saudi Arabia | 85.6 /100 | #145 | Excellent $47,704 |
| Immigrants | Chile | 85.5 /100 | #146 | Excellent $47,697 |
| Immigrants | South Eastern Asia | 85.0 /100 | #147 | Excellent $47,671 |
| Immigrants | Eritrea | 84.8 /100 | #148 | Excellent $47,657 |
| Luxembourgers | 84.5 /100 | #149 | Excellent $47,640 |
| Peruvians | 84.2 /100 | #150 | Excellent $47,628 |
| Immigrants | Oceania | 84.1 /100 | #151 | Excellent $47,617 |
| Immigrants | Germany | 83.1 /100 | #152 | Excellent $47,566 |
| Slavs | 81.1 /100 | #153 | Excellent $47,470 |
| Immigrants | Portugal | 77.3 /100 | #154 | Good $47,304 |
| Immigrants | Vietnam | 76.7 /100 | #155 | Good $47,282 |
| Irish | 76.6 /100 | #156 | Good $47,276 |
| Czechs | 75.1 /100 | #157 | Good $47,221 |
| Slovaks | 71.7 /100 | #158 | Good $47,095 |
| Immigrants | Peru | 69.6 /100 | #159 | Good $47,025 |
Demographics Similar to Carpatho Rusyns by Median Earnings
In terms of median earnings, the demographic groups most similar to Carpatho Rusyns are Arab ($48,599, a difference of 0.040%), Polish ($48,659, a difference of 0.080%), Immigrants from Jordan ($48,673, a difference of 0.11%), Serbian ($48,677, a difference of 0.12%), and Korean ($48,727, a difference of 0.23%).
| Demographics | Rating | Rank | Median Earnings |
| Immigrants | Kuwait | 96.8 /100 | #113 | Exceptional $48,861 |
| Moroccans | 96.7 /100 | #114 | Exceptional $48,838 |
| Chinese | 96.7 /100 | #115 | Exceptional $48,836 |
| Koreans | 96.2 /100 | #116 | Exceptional $48,727 |
| Serbians | 95.9 /100 | #117 | Exceptional $48,677 |
| Immigrants | Jordan | 95.9 /100 | #118 | Exceptional $48,673 |
| Poles | 95.8 /100 | #119 | Exceptional $48,659 |
| Carpatho Rusyns | 95.5 /100 | #120 | Exceptional $48,617 |
| Arabs | 95.4 /100 | #121 | Exceptional $48,599 |
| Chileans | 94.8 /100 | #122 | Exceptional $48,504 |
| Immigrants | Syria | 93.9 /100 | #123 | Exceptional $48,375 |
| Brazilians | 93.7 /100 | #124 | Exceptional $48,356 |
| Immigrants | Fiji | 93.3 /100 | #125 | Exceptional $48,305 |
| Assyrians/Chaldeans/Syriacs | 93.3 /100 | #126 | Exceptional $48,304 |
| Sierra Leoneans | 93.1 /100 | #127 | Exceptional $48,286 |