Mexican American Indian vs Immigrants from Bahamas Per Capita Income
COMPARE
Mexican American Indian
Immigrants from Bahamas
Per Capita Income
Per Capita Income Comparison
Mexican American Indians
Immigrants from Bahamas
$37,407
PER CAPITA INCOME
0.1/ 100
METRIC RATING
293rd/ 347
METRIC RANK
$37,193
PER CAPITA INCOME
0.1/ 100
METRIC RATING
300th/ 347
METRIC RANK
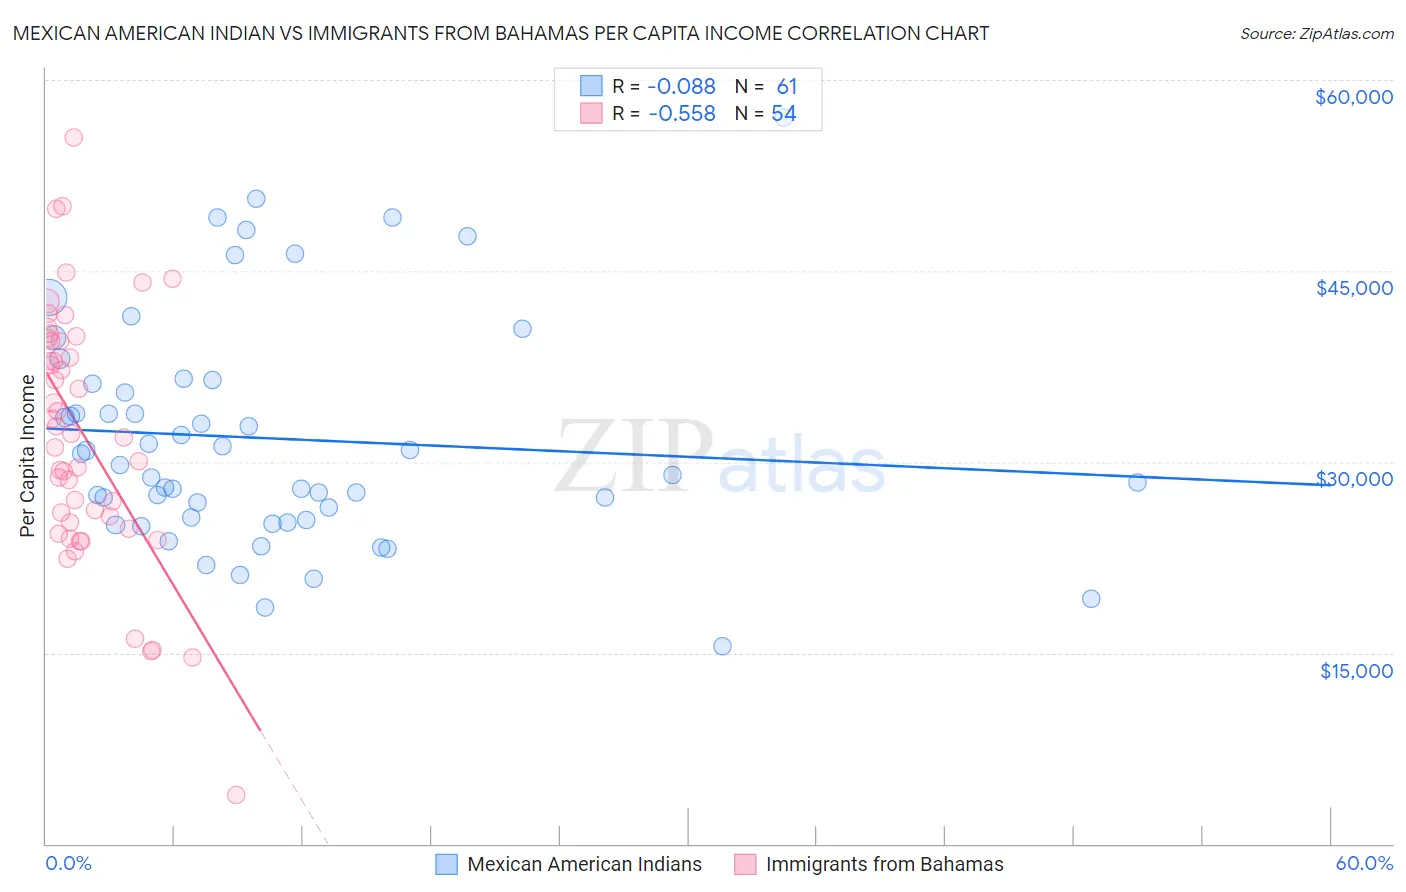
Mexican American Indian vs Immigrants from Bahamas Per Capita Income Correlation Chart
The statistical analysis conducted on geographies consisting of 317,620,021 people shows a slight negative correlation between the proportion of Mexican American Indians and per capita income in the United States with a correlation coefficient (R) of -0.088 and weighted average of $37,407. Similarly, the statistical analysis conducted on geographies consisting of 104,665,550 people shows a substantial negative correlation between the proportion of Immigrants from Bahamas and per capita income in the United States with a correlation coefficient (R) of -0.558 and weighted average of $37,193, a difference of 0.58%.
Per Capita Income Correlation Summary
| Measurement | Mexican American Indian | Immigrants from Bahamas |
| Minimum | $15,543 | $3,864 |
| Maximum | $57,099 | $55,468 |
| Range | $41,556 | $51,604 |
| Mean | $31,846 | $32,077 |
| Median | $29,756 | $32,055 |
| Interquartile 25% (IQ1) | $25,545 | $25,247 |
| Interquartile 75% (IQ3) | $36,256 | $39,474 |
| Interquartile Range (IQR) | $10,711 | $14,227 |
| Standard Deviation (Sample) | $8,902 | $9,963 |
| Standard Deviation (Population) | $8,828 | $9,870 |
Demographics Similar to Mexican American Indians and Immigrants from Bahamas by Per Capita Income
In terms of per capita income, the demographic groups most similar to Mexican American Indians are Cuban ($37,383, a difference of 0.070%), Immigrants from Micronesia ($37,464, a difference of 0.15%), Immigrants from Dominican Republic ($37,306, a difference of 0.27%), Indonesian ($37,300, a difference of 0.29%), and Cajun ($37,527, a difference of 0.32%). Similarly, the demographic groups most similar to Immigrants from Bahamas are Cherokee ($37,203, a difference of 0.030%), Immigrants from Caribbean ($37,254, a difference of 0.17%), Ottawa ($37,101, a difference of 0.25%), Haitian ($37,289, a difference of 0.26%), and Indonesian ($37,300, a difference of 0.29%).
| Demographics | Rating | Rank | Per Capita Income |
| Central American Indians | 0.1 /100 | #286 | Tragic $37,699 |
| Dominicans | 0.1 /100 | #287 | Tragic $37,697 |
| Blackfeet | 0.1 /100 | #288 | Tragic $37,695 |
| U.S. Virgin Islanders | 0.1 /100 | #289 | Tragic $37,589 |
| Immigrants | Guatemala | 0.1 /100 | #290 | Tragic $37,550 |
| Cajuns | 0.1 /100 | #291 | Tragic $37,527 |
| Immigrants | Micronesia | 0.1 /100 | #292 | Tragic $37,464 |
| Mexican American Indians | 0.1 /100 | #293 | Tragic $37,407 |
| Cubans | 0.1 /100 | #294 | Tragic $37,383 |
| Immigrants | Dominican Republic | 0.1 /100 | #295 | Tragic $37,306 |
| Indonesians | 0.1 /100 | #296 | Tragic $37,300 |
| Haitians | 0.1 /100 | #297 | Tragic $37,289 |
| Immigrants | Caribbean | 0.1 /100 | #298 | Tragic $37,254 |
| Cherokee | 0.1 /100 | #299 | Tragic $37,203 |
| Immigrants | Bahamas | 0.1 /100 | #300 | Tragic $37,193 |
| Ottawa | 0.1 /100 | #301 | Tragic $37,101 |
| Shoshone | 0.1 /100 | #302 | Tragic $37,072 |
| Paiute | 0.1 /100 | #303 | Tragic $37,066 |
| Hondurans | 0.1 /100 | #304 | Tragic $37,031 |
| Inupiat | 0.1 /100 | #305 | Tragic $36,999 |
| Immigrants | Haiti | 0.0 /100 | #306 | Tragic $36,849 |