Immigrants from Fiji vs Immigrants from Israel Householder Income Ages 25 - 44 years
COMPARE
Immigrants from Fiji
Immigrants from Israel
Householder Income Ages 25 - 44 years
Householder Income Ages 25 - 44 years Comparison
Immigrants from Fiji
Immigrants from Israel
$103,954
HOUSEHOLDER INCOME AGES 25 - 44 YEARS
99.5/ 100
METRIC RATING
74th/ 347
METRIC RANK
$117,219
HOUSEHOLDER INCOME AGES 25 - 44 YEARS
100.0/ 100
METRIC RATING
14th/ 347
METRIC RANK
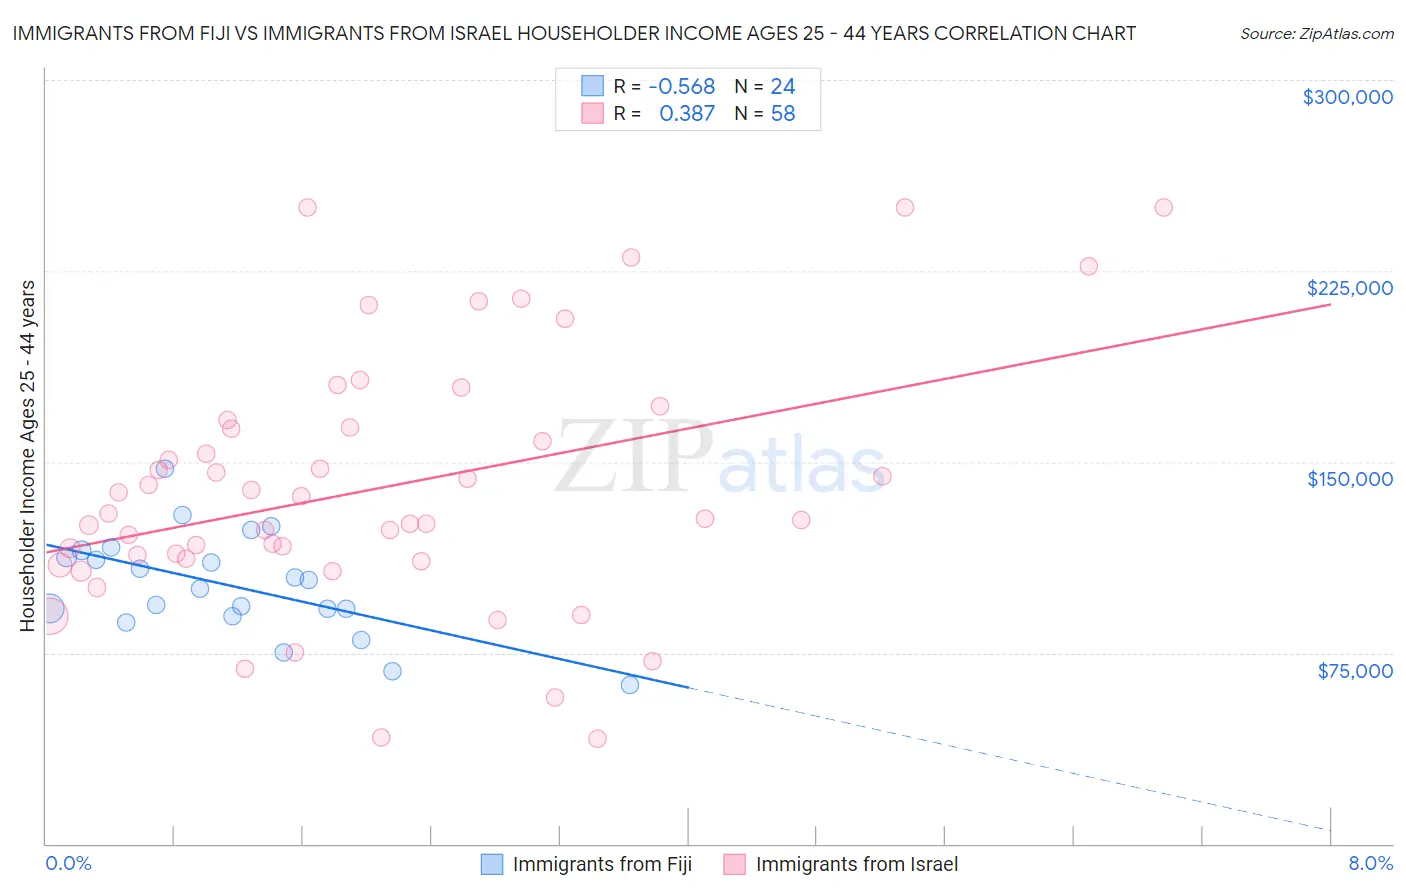
Immigrants from Fiji vs Immigrants from Israel Householder Income Ages 25 - 44 years Correlation Chart
The statistical analysis conducted on geographies consisting of 93,741,539 people shows a substantial negative correlation between the proportion of Immigrants from Fiji and household income with householder between the ages 25 and 44 in the United States with a correlation coefficient (R) of -0.568 and weighted average of $103,954. Similarly, the statistical analysis conducted on geographies consisting of 209,652,410 people shows a mild positive correlation between the proportion of Immigrants from Israel and household income with householder between the ages 25 and 44 in the United States with a correlation coefficient (R) of 0.387 and weighted average of $117,219, a difference of 12.8%.
Householder Income Ages 25 - 44 years Correlation Summary
| Measurement | Immigrants from Fiji | Immigrants from Israel |
| Minimum | $62,417 | $41,167 |
| Maximum | $147,220 | $250,001 |
| Range | $84,803 | $208,834 |
| Mean | $101,378 | $139,627 |
| Median | $101,962 | $128,756 |
| Interquartile 25% (IQ1) | $90,849 | $112,036 |
| Interquartile 75% (IQ3) | $113,947 | $163,605 |
| Interquartile Range (IQR) | $23,098 | $51,569 |
| Standard Deviation (Sample) | $20,004 | $49,677 |
| Standard Deviation (Population) | $19,583 | $49,247 |
Similar Demographics by Householder Income Ages 25 - 44 years
Demographics Similar to Immigrants from Fiji by Householder Income Ages 25 - 44 years
In terms of householder income ages 25 - 44 years, the demographic groups most similar to Immigrants from Fiji are Korean ($103,824, a difference of 0.13%), Immigrants from Spain ($103,752, a difference of 0.19%), Italian ($104,215, a difference of 0.25%), Chinese ($104,264, a difference of 0.30%), and Afghan ($104,410, a difference of 0.44%).
| Demographics | Rating | Rank | Householder Income Ages 25 - 44 years |
| Immigrants | Romania | 99.6 /100 | #67 | Exceptional $104,713 |
| Immigrants | Eastern Europe | 99.6 /100 | #68 | Exceptional $104,662 |
| Mongolians | 99.6 /100 | #69 | Exceptional $104,578 |
| Immigrants | Croatia | 99.6 /100 | #70 | Exceptional $104,503 |
| Afghans | 99.6 /100 | #71 | Exceptional $104,410 |
| Chinese | 99.5 /100 | #72 | Exceptional $104,264 |
| Italians | 99.5 /100 | #73 | Exceptional $104,215 |
| Immigrants | Fiji | 99.5 /100 | #74 | Exceptional $103,954 |
| Koreans | 99.4 /100 | #75 | Exceptional $103,824 |
| Immigrants | Spain | 99.4 /100 | #76 | Exceptional $103,752 |
| Immigrants | Southern Europe | 99.3 /100 | #77 | Exceptional $103,486 |
| Immigrants | Bulgaria | 99.3 /100 | #78 | Exceptional $103,423 |
| Armenians | 99.2 /100 | #79 | Exceptional $103,248 |
| Immigrants | Egypt | 99.2 /100 | #80 | Exceptional $103,192 |
| South Africans | 99.2 /100 | #81 | Exceptional $103,160 |
Demographics Similar to Immigrants from Israel by Householder Income Ages 25 - 44 years
In terms of householder income ages 25 - 44 years, the demographic groups most similar to Immigrants from Israel are Immigrants from South Central Asia ($116,626, a difference of 0.51%), Immigrants from Eastern Asia ($118,056, a difference of 0.71%), Cypriot ($116,364, a difference of 0.73%), Immigrants from Australia ($115,947, a difference of 1.1%), and Immigrants from Iran ($119,204, a difference of 1.7%).
| Demographics | Rating | Rank | Householder Income Ages 25 - 44 years |
| Immigrants | Ireland | 100.0 /100 | #7 | Exceptional $120,333 |
| Iranians | 100.0 /100 | #8 | Exceptional $120,292 |
| Immigrants | China | 100.0 /100 | #9 | Exceptional $119,756 |
| Indians (Asian) | 100.0 /100 | #10 | Exceptional $119,496 |
| Okinawans | 100.0 /100 | #11 | Exceptional $119,349 |
| Immigrants | Iran | 100.0 /100 | #12 | Exceptional $119,204 |
| Immigrants | Eastern Asia | 100.0 /100 | #13 | Exceptional $118,056 |
| Immigrants | Israel | 100.0 /100 | #14 | Exceptional $117,219 |
| Immigrants | South Central Asia | 100.0 /100 | #15 | Exceptional $116,626 |
| Cypriots | 100.0 /100 | #16 | Exceptional $116,364 |
| Immigrants | Australia | 100.0 /100 | #17 | Exceptional $115,947 |
| Eastern Europeans | 100.0 /100 | #18 | Exceptional $114,523 |
| Burmese | 100.0 /100 | #19 | Exceptional $113,701 |
| Immigrants | Korea | 100.0 /100 | #20 | Exceptional $113,401 |
| Asians | 100.0 /100 | #21 | Exceptional $112,666 |