Sudanese vs Immigrants from Israel Householder Income Ages 25 - 44 years
COMPARE
Sudanese
Immigrants from Israel
Householder Income Ages 25 - 44 years
Householder Income Ages 25 - 44 years Comparison
Sudanese
Immigrants from Israel
$84,401
HOUSEHOLDER INCOME AGES 25 - 44 YEARS
0.4/ 100
METRIC RATING
265th/ 347
METRIC RANK
$117,219
HOUSEHOLDER INCOME AGES 25 - 44 YEARS
100.0/ 100
METRIC RATING
14th/ 347
METRIC RANK
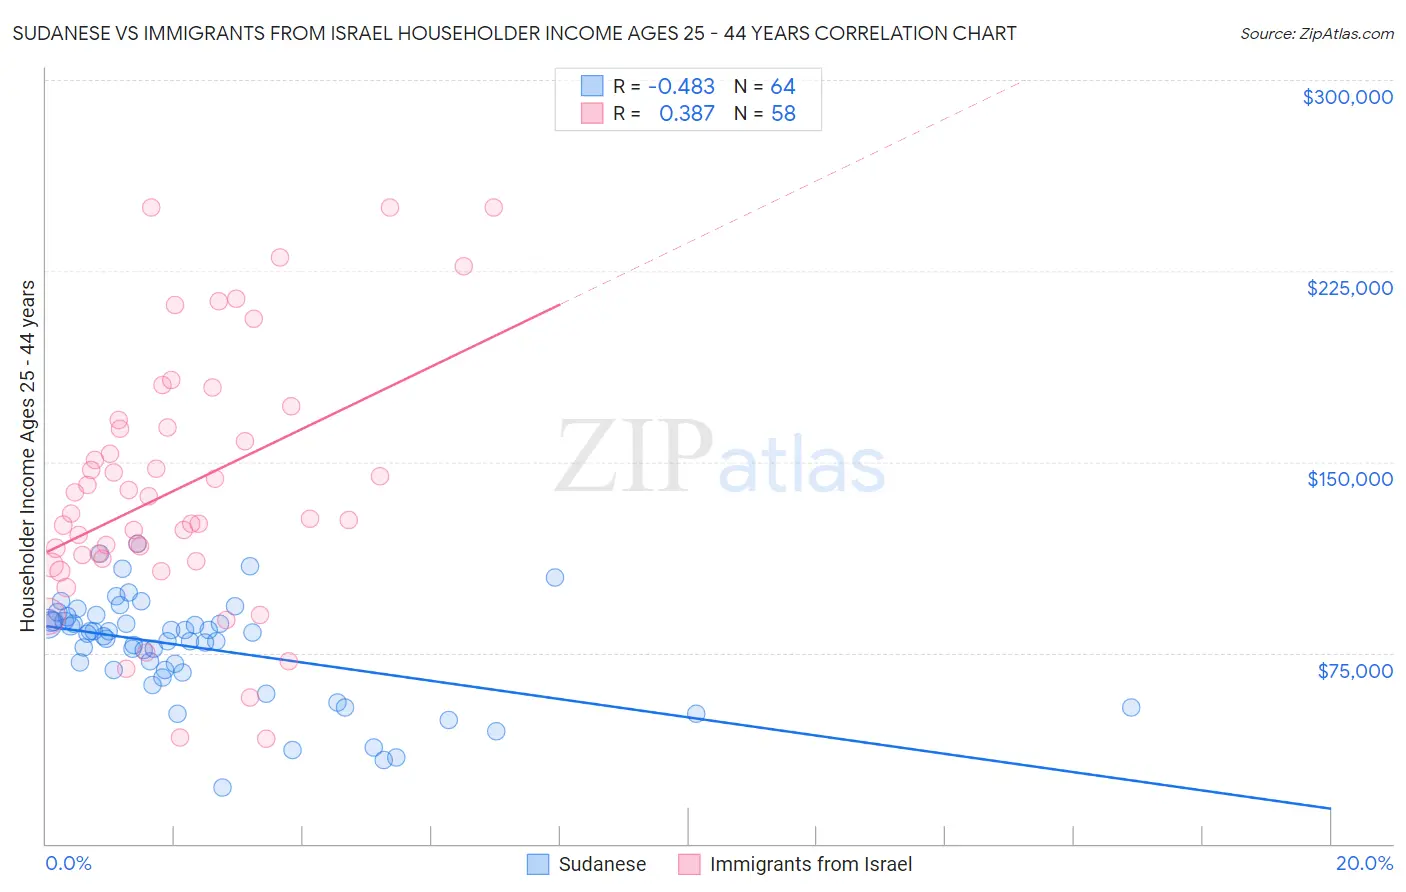
Sudanese vs Immigrants from Israel Householder Income Ages 25 - 44 years Correlation Chart
The statistical analysis conducted on geographies consisting of 110,044,809 people shows a moderate negative correlation between the proportion of Sudanese and household income with householder between the ages 25 and 44 in the United States with a correlation coefficient (R) of -0.483 and weighted average of $84,401. Similarly, the statistical analysis conducted on geographies consisting of 209,652,410 people shows a mild positive correlation between the proportion of Immigrants from Israel and household income with householder between the ages 25 and 44 in the United States with a correlation coefficient (R) of 0.387 and weighted average of $117,219, a difference of 38.9%.
Householder Income Ages 25 - 44 years Correlation Summary
| Measurement | Sudanese | Immigrants from Israel |
| Minimum | $22,303 | $41,167 |
| Maximum | $117,632 | $250,001 |
| Range | $95,330 | $208,834 |
| Mean | $76,942 | $139,627 |
| Median | $82,204 | $128,756 |
| Interquartile 25% (IQ1) | $67,535 | $112,036 |
| Interquartile 75% (IQ3) | $87,340 | $163,605 |
| Interquartile Range (IQR) | $19,805 | $51,569 |
| Standard Deviation (Sample) | $20,185 | $49,677 |
| Standard Deviation (Population) | $20,027 | $49,247 |
Similar Demographics by Householder Income Ages 25 - 44 years
Demographics Similar to Sudanese by Householder Income Ages 25 - 44 years
In terms of householder income ages 25 - 44 years, the demographic groups most similar to Sudanese are Osage ($84,461, a difference of 0.070%), Immigrants from Cabo Verde ($84,304, a difference of 0.12%), Belizean ($84,534, a difference of 0.16%), Hmong ($84,258, a difference of 0.17%), and Cree ($84,574, a difference of 0.20%).
| Demographics | Rating | Rank | Householder Income Ages 25 - 44 years |
| Immigrants | Nicaragua | 0.5 /100 | #258 | Tragic $84,914 |
| Immigrants | Senegal | 0.5 /100 | #259 | Tragic $84,848 |
| Americans | 0.4 /100 | #260 | Tragic $84,791 |
| Inupiat | 0.4 /100 | #261 | Tragic $84,619 |
| Cree | 0.4 /100 | #262 | Tragic $84,574 |
| Belizeans | 0.4 /100 | #263 | Tragic $84,534 |
| Osage | 0.4 /100 | #264 | Tragic $84,461 |
| Sudanese | 0.4 /100 | #265 | Tragic $84,401 |
| Immigrants | Cabo Verde | 0.3 /100 | #266 | Tragic $84,304 |
| Hmong | 0.3 /100 | #267 | Tragic $84,258 |
| Sub-Saharan Africans | 0.3 /100 | #268 | Tragic $84,235 |
| Spanish American Indians | 0.3 /100 | #269 | Tragic $84,085 |
| Jamaicans | 0.3 /100 | #270 | Tragic $83,933 |
| Somalis | 0.2 /100 | #271 | Tragic $83,752 |
| Spanish Americans | 0.2 /100 | #272 | Tragic $83,722 |
Demographics Similar to Immigrants from Israel by Householder Income Ages 25 - 44 years
In terms of householder income ages 25 - 44 years, the demographic groups most similar to Immigrants from Israel are Immigrants from South Central Asia ($116,626, a difference of 0.51%), Immigrants from Eastern Asia ($118,056, a difference of 0.71%), Cypriot ($116,364, a difference of 0.73%), Immigrants from Australia ($115,947, a difference of 1.1%), and Immigrants from Iran ($119,204, a difference of 1.7%).
| Demographics | Rating | Rank | Householder Income Ages 25 - 44 years |
| Immigrants | Ireland | 100.0 /100 | #7 | Exceptional $120,333 |
| Iranians | 100.0 /100 | #8 | Exceptional $120,292 |
| Immigrants | China | 100.0 /100 | #9 | Exceptional $119,756 |
| Indians (Asian) | 100.0 /100 | #10 | Exceptional $119,496 |
| Okinawans | 100.0 /100 | #11 | Exceptional $119,349 |
| Immigrants | Iran | 100.0 /100 | #12 | Exceptional $119,204 |
| Immigrants | Eastern Asia | 100.0 /100 | #13 | Exceptional $118,056 |
| Immigrants | Israel | 100.0 /100 | #14 | Exceptional $117,219 |
| Immigrants | South Central Asia | 100.0 /100 | #15 | Exceptional $116,626 |
| Cypriots | 100.0 /100 | #16 | Exceptional $116,364 |
| Immigrants | Australia | 100.0 /100 | #17 | Exceptional $115,947 |
| Eastern Europeans | 100.0 /100 | #18 | Exceptional $114,523 |
| Burmese | 100.0 /100 | #19 | Exceptional $113,701 |
| Immigrants | Korea | 100.0 /100 | #20 | Exceptional $113,401 |
| Asians | 100.0 /100 | #21 | Exceptional $112,666 |