Lebanese vs Immigrants from Israel Householder Income Ages 25 - 44 years
COMPARE
Lebanese
Immigrants from Israel
Householder Income Ages 25 - 44 years
Householder Income Ages 25 - 44 years Comparison
Lebanese
Immigrants from Israel
$97,339
HOUSEHOLDER INCOME AGES 25 - 44 YEARS
82.3/ 100
METRIC RATING
137th/ 347
METRIC RANK
$117,219
HOUSEHOLDER INCOME AGES 25 - 44 YEARS
100.0/ 100
METRIC RATING
14th/ 347
METRIC RANK
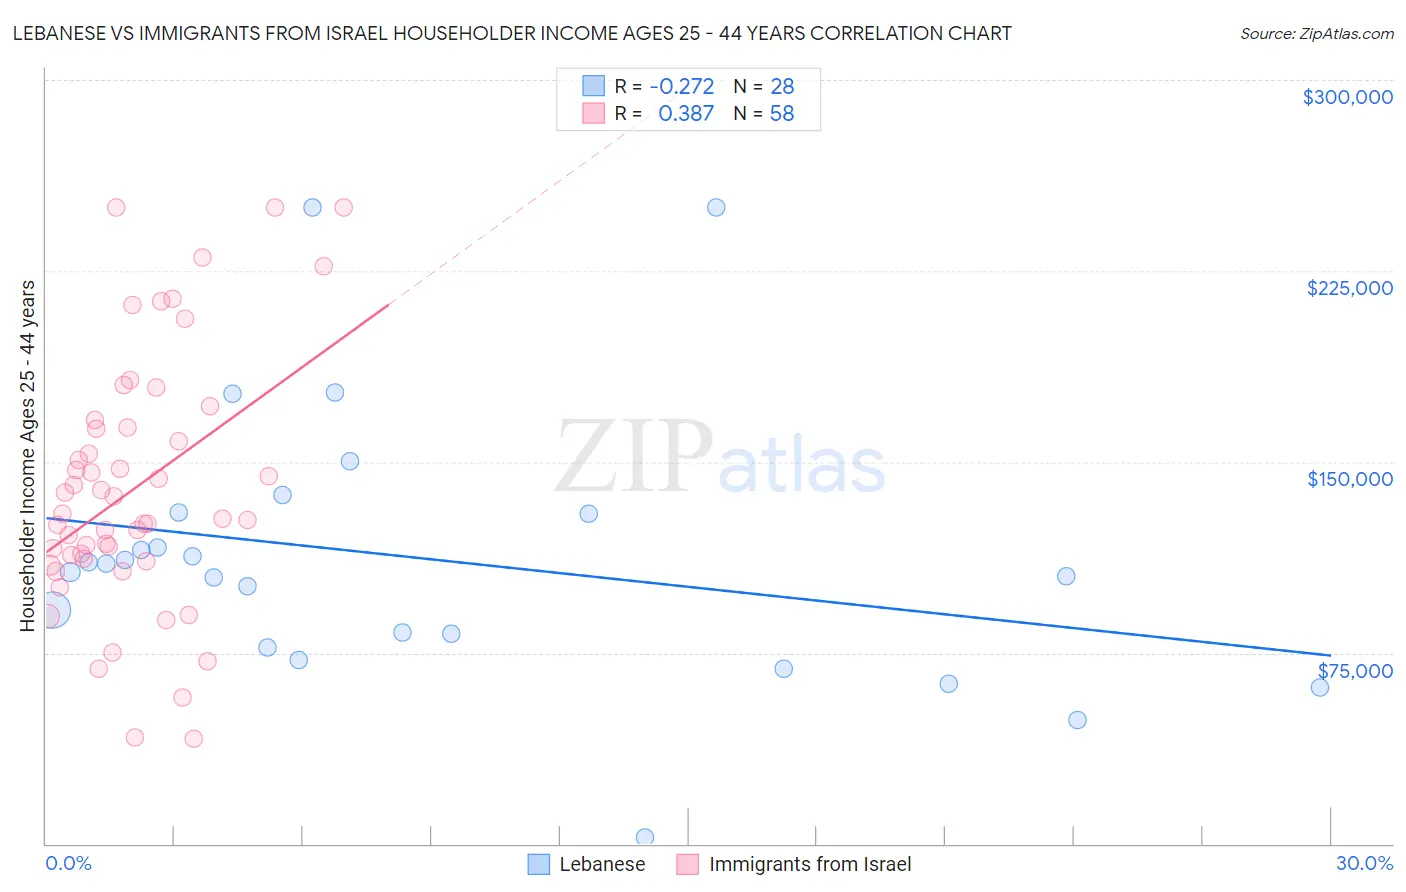
Lebanese vs Immigrants from Israel Householder Income Ages 25 - 44 years Correlation Chart
The statistical analysis conducted on geographies consisting of 400,475,460 people shows a weak negative correlation between the proportion of Lebanese and household income with householder between the ages 25 and 44 in the United States with a correlation coefficient (R) of -0.272 and weighted average of $97,339. Similarly, the statistical analysis conducted on geographies consisting of 209,652,410 people shows a mild positive correlation between the proportion of Immigrants from Israel and household income with householder between the ages 25 and 44 in the United States with a correlation coefficient (R) of 0.387 and weighted average of $117,219, a difference of 20.4%.
Householder Income Ages 25 - 44 years Correlation Summary
| Measurement | Lebanese | Immigrants from Israel |
| Minimum | $2,499 | $41,167 |
| Maximum | $250,001 | $250,001 |
| Range | $247,502 | $208,834 |
| Mean | $112,372 | $139,627 |
| Median | $108,314 | $128,756 |
| Interquartile 25% (IQ1) | $79,902 | $112,036 |
| Interquartile 75% (IQ3) | $129,887 | $163,605 |
| Interquartile Range (IQR) | $49,985 | $51,569 |
| Standard Deviation (Sample) | $53,521 | $49,677 |
| Standard Deviation (Population) | $52,557 | $49,247 |
Similar Demographics by Householder Income Ages 25 - 44 years
Demographics Similar to Lebanese by Householder Income Ages 25 - 44 years
In terms of householder income ages 25 - 44 years, the demographic groups most similar to Lebanese are Arab ($97,336, a difference of 0.0%), Immigrants from Peru ($97,329, a difference of 0.010%), Immigrants from Morocco ($97,305, a difference of 0.030%), Luxembourger ($97,237, a difference of 0.10%), and Danish ($97,221, a difference of 0.12%).
| Demographics | Rating | Rank | Householder Income Ages 25 - 44 years |
| Immigrants | Kuwait | 87.8 /100 | #130 | Excellent $98,122 |
| Immigrants | Albania | 86.6 /100 | #131 | Excellent $97,929 |
| Immigrants | Zimbabwe | 86.3 /100 | #132 | Excellent $97,880 |
| Tsimshian | 85.8 /100 | #133 | Excellent $97,809 |
| Canadians | 84.5 /100 | #134 | Excellent $97,625 |
| Immigrants | Oceania | 84.5 /100 | #135 | Excellent $97,623 |
| Hungarians | 83.9 /100 | #136 | Excellent $97,544 |
| Lebanese | 82.3 /100 | #137 | Excellent $97,339 |
| Arabs | 82.3 /100 | #138 | Excellent $97,336 |
| Immigrants | Peru | 82.2 /100 | #139 | Excellent $97,329 |
| Immigrants | Morocco | 82.0 /100 | #140 | Excellent $97,305 |
| Luxembourgers | 81.5 /100 | #141 | Excellent $97,237 |
| Danes | 81.3 /100 | #142 | Excellent $97,221 |
| Immigrants | Jordan | 81.0 /100 | #143 | Excellent $97,185 |
| Immigrants | Chile | 80.8 /100 | #144 | Excellent $97,159 |
Demographics Similar to Immigrants from Israel by Householder Income Ages 25 - 44 years
In terms of householder income ages 25 - 44 years, the demographic groups most similar to Immigrants from Israel are Immigrants from South Central Asia ($116,626, a difference of 0.51%), Immigrants from Eastern Asia ($118,056, a difference of 0.71%), Cypriot ($116,364, a difference of 0.73%), Immigrants from Australia ($115,947, a difference of 1.1%), and Immigrants from Iran ($119,204, a difference of 1.7%).
| Demographics | Rating | Rank | Householder Income Ages 25 - 44 years |
| Immigrants | Ireland | 100.0 /100 | #7 | Exceptional $120,333 |
| Iranians | 100.0 /100 | #8 | Exceptional $120,292 |
| Immigrants | China | 100.0 /100 | #9 | Exceptional $119,756 |
| Indians (Asian) | 100.0 /100 | #10 | Exceptional $119,496 |
| Okinawans | 100.0 /100 | #11 | Exceptional $119,349 |
| Immigrants | Iran | 100.0 /100 | #12 | Exceptional $119,204 |
| Immigrants | Eastern Asia | 100.0 /100 | #13 | Exceptional $118,056 |
| Immigrants | Israel | 100.0 /100 | #14 | Exceptional $117,219 |
| Immigrants | South Central Asia | 100.0 /100 | #15 | Exceptional $116,626 |
| Cypriots | 100.0 /100 | #16 | Exceptional $116,364 |
| Immigrants | Australia | 100.0 /100 | #17 | Exceptional $115,947 |
| Eastern Europeans | 100.0 /100 | #18 | Exceptional $114,523 |
| Burmese | 100.0 /100 | #19 | Exceptional $113,701 |
| Immigrants | Korea | 100.0 /100 | #20 | Exceptional $113,401 |
| Asians | 100.0 /100 | #21 | Exceptional $112,666 |