Menominee vs Greek Professional Degree
COMPARE
Menominee
Greek
Professional Degree
Professional Degree Comparison
Menominee
Greeks
3.1%
PROFESSIONAL DEGREE
0.0/ 100
METRIC RATING
326th/ 347
METRIC RANK
5.3%
PROFESSIONAL DEGREE
99.6/ 100
METRIC RATING
86th/ 347
METRIC RANK
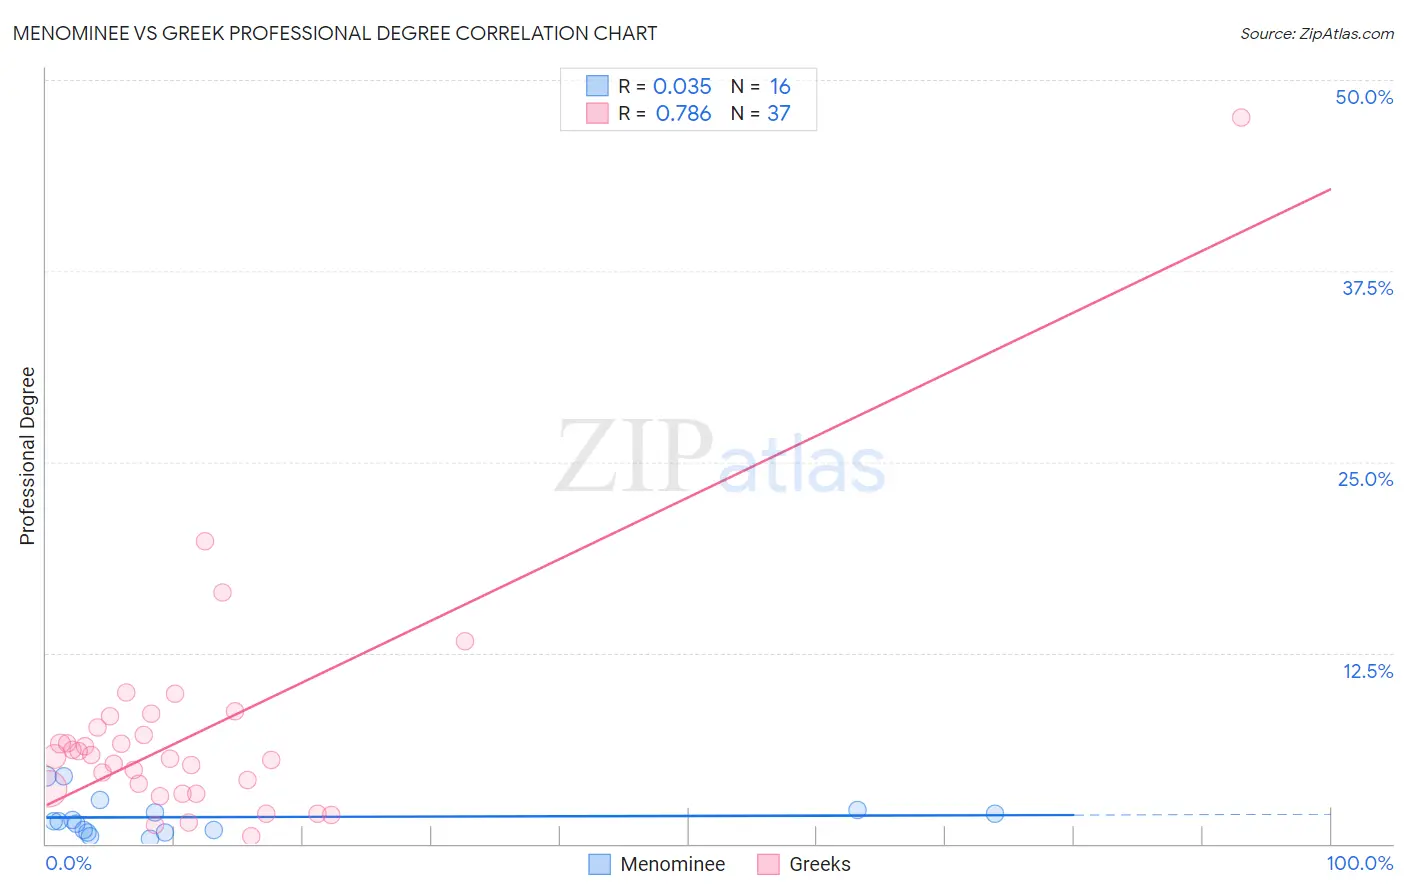
Menominee vs Greek Professional Degree Correlation Chart
The statistical analysis conducted on geographies consisting of 45,721,349 people shows no correlation between the proportion of Menominee and percentage of population with at least professional degree education in the United States with a correlation coefficient (R) of 0.035 and weighted average of 3.1%. Similarly, the statistical analysis conducted on geographies consisting of 480,768,816 people shows a strong positive correlation between the proportion of Greeks and percentage of population with at least professional degree education in the United States with a correlation coefficient (R) of 0.786 and weighted average of 5.3%, a difference of 70.0%.
Professional Degree Correlation Summary
| Measurement | Menominee | Greek |
| Minimum | 0.35% | 0.52% |
| Maximum | 4.4% | 47.6% |
| Range | 4.1% | 47.0% |
| Mean | 1.7% | 7.2% |
| Median | 1.5% | 5.7% |
| Interquartile 25% (IQ1) | 0.82% | 3.4% |
| Interquartile 75% (IQ3) | 2.1% | 8.0% |
| Interquartile Range (IQR) | 1.3% | 4.6% |
| Standard Deviation (Sample) | 1.2% | 7.9% |
| Standard Deviation (Population) | 1.2% | 7.8% |
Similar Demographics by Professional Degree
Demographics Similar to Menominee by Professional Degree
In terms of professional degree, the demographic groups most similar to Menominee are Dutch West Indian (3.1%, a difference of 0.10%), Creek (3.1%, a difference of 0.16%), Bangladeshi (3.1%, a difference of 0.37%), Immigrants from Cabo Verde (3.1%, a difference of 0.45%), and Kiowa (3.1%, a difference of 0.57%).
| Demographics | Rating | Rank | Professional Degree |
| Choctaw | 0.1 /100 | #319 | Tragic 3.2% |
| Seminole | 0.1 /100 | #320 | Tragic 3.2% |
| Tsimshian | 0.0 /100 | #321 | Tragic 3.2% |
| Hispanics or Latinos | 0.0 /100 | #322 | Tragic 3.2% |
| Inupiat | 0.0 /100 | #323 | Tragic 3.2% |
| Crow | 0.0 /100 | #324 | Tragic 3.2% |
| Yaqui | 0.0 /100 | #325 | Tragic 3.2% |
| Menominee | 0.0 /100 | #326 | Tragic 3.1% |
| Dutch West Indians | 0.0 /100 | #327 | Tragic 3.1% |
| Creek | 0.0 /100 | #328 | Tragic 3.1% |
| Bangladeshis | 0.0 /100 | #329 | Tragic 3.1% |
| Immigrants | Cabo Verde | 0.0 /100 | #330 | Tragic 3.1% |
| Kiowa | 0.0 /100 | #331 | Tragic 3.1% |
| Yakama | 0.0 /100 | #332 | Tragic 3.1% |
| Puget Sound Salish | 0.0 /100 | #333 | Tragic 3.1% |
Demographics Similar to Greeks by Professional Degree
In terms of professional degree, the demographic groups most similar to Greeks are Immigrants from Zimbabwe (5.3%, a difference of 0.0%), Carpatho Rusyn (5.3%, a difference of 0.020%), Immigrants from Croatia (5.3%, a difference of 0.020%), Immigrants from Chile (5.3%, a difference of 0.11%), and Romanian (5.3%, a difference of 0.23%).
| Demographics | Rating | Rank | Professional Degree |
| Immigrants | North America | 99.7 /100 | #79 | Exceptional 5.3% |
| Immigrants | England | 99.6 /100 | #80 | Exceptional 5.3% |
| Immigrants | Brazil | 99.6 /100 | #81 | Exceptional 5.3% |
| Romanians | 99.6 /100 | #82 | Exceptional 5.3% |
| Carpatho Rusyns | 99.6 /100 | #83 | Exceptional 5.3% |
| Immigrants | Croatia | 99.6 /100 | #84 | Exceptional 5.3% |
| Immigrants | Zimbabwe | 99.6 /100 | #85 | Exceptional 5.3% |
| Greeks | 99.6 /100 | #86 | Exceptional 5.3% |
| Immigrants | Chile | 99.5 /100 | #87 | Exceptional 5.3% |
| Egyptians | 99.5 /100 | #88 | Exceptional 5.3% |
| Chileans | 99.5 /100 | #89 | Exceptional 5.3% |
| Immigrants | Scotland | 99.5 /100 | #90 | Exceptional 5.3% |
| Laotians | 99.5 /100 | #91 | Exceptional 5.2% |
| Immigrants | Eastern Europe | 99.5 /100 | #92 | Exceptional 5.2% |
| Northern Europeans | 99.3 /100 | #93 | Exceptional 5.2% |