Maltese vs Bermudan Median Male Earnings
COMPARE
Maltese
Bermudan
Median Male Earnings
Median Male Earnings Comparison
Maltese
Bermudans
$62,953
MEDIAN MALE EARNINGS
100.0/ 100
METRIC RATING
38th/ 347
METRIC RANK
$52,465
MEDIAN MALE EARNINGS
12.1/ 100
METRIC RATING
209th/ 347
METRIC RANK
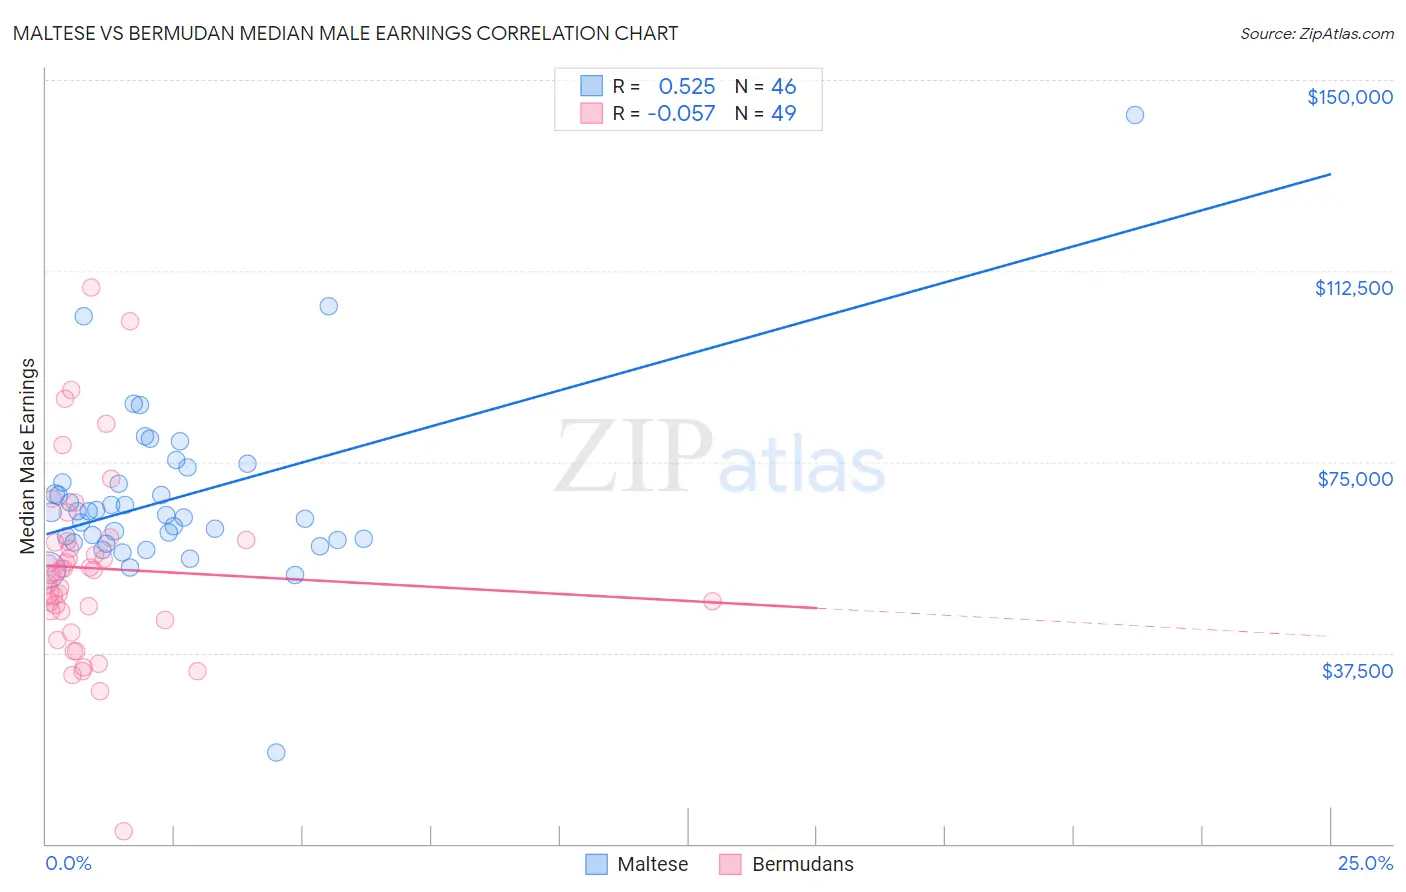
Maltese vs Bermudan Median Male Earnings Correlation Chart
The statistical analysis conducted on geographies consisting of 126,470,445 people shows a substantial positive correlation between the proportion of Maltese and median male earnings in the United States with a correlation coefficient (R) of 0.525 and weighted average of $62,953. Similarly, the statistical analysis conducted on geographies consisting of 55,727,224 people shows a slight negative correlation between the proportion of Bermudans and median male earnings in the United States with a correlation coefficient (R) of -0.057 and weighted average of $52,465, a difference of 20.0%.
Median Male Earnings Correlation Summary
| Measurement | Maltese | Bermudan |
| Minimum | $17,917 | $2,499 |
| Maximum | $143,125 | $109,250 |
| Range | $125,208 | $106,751 |
| Mean | $67,890 | $54,094 |
| Median | $64,879 | $53,290 |
| Interquartile 25% (IQ1) | $59,600 | $44,820 |
| Interquartile 75% (IQ3) | $71,008 | $59,519 |
| Interquartile Range (IQR) | $11,408 | $14,700 |
| Standard Deviation (Sample) | $17,590 | $18,662 |
| Standard Deviation (Population) | $17,397 | $18,471 |
Similar Demographics by Median Male Earnings
Demographics Similar to Maltese by Median Male Earnings
In terms of median male earnings, the demographic groups most similar to Maltese are Immigrants from South Africa ($62,899, a difference of 0.090%), Australian ($62,857, a difference of 0.15%), Immigrants from Sri Lanka ($63,099, a difference of 0.23%), Immigrants from Turkey ($62,728, a difference of 0.36%), and Immigrants from Greece ($62,689, a difference of 0.42%).
| Demographics | Rating | Rank | Median Male Earnings |
| Latvians | 100.0 /100 | #31 | Exceptional $63,498 |
| Soviet Union | 100.0 /100 | #32 | Exceptional $63,382 |
| Immigrants | Lithuania | 100.0 /100 | #33 | Exceptional $63,346 |
| Immigrants | Russia | 100.0 /100 | #34 | Exceptional $63,326 |
| Immigrants | Asia | 100.0 /100 | #35 | Exceptional $63,240 |
| Israelis | 100.0 /100 | #36 | Exceptional $63,228 |
| Immigrants | Sri Lanka | 100.0 /100 | #37 | Exceptional $63,099 |
| Maltese | 100.0 /100 | #38 | Exceptional $62,953 |
| Immigrants | South Africa | 100.0 /100 | #39 | Exceptional $62,899 |
| Australians | 100.0 /100 | #40 | Exceptional $62,857 |
| Immigrants | Turkey | 100.0 /100 | #41 | Exceptional $62,728 |
| Immigrants | Greece | 100.0 /100 | #42 | Exceptional $62,689 |
| Immigrants | Belarus | 100.0 /100 | #43 | Exceptional $62,658 |
| Cambodians | 100.0 /100 | #44 | Exceptional $62,516 |
| Bulgarians | 100.0 /100 | #45 | Exceptional $62,378 |
Demographics Similar to Bermudans by Median Male Earnings
In terms of median male earnings, the demographic groups most similar to Bermudans are Venezuelan ($52,510, a difference of 0.090%), Delaware ($52,412, a difference of 0.10%), Vietnamese ($52,525, a difference of 0.11%), Tlingit-Haida ($52,409, a difference of 0.11%), and Cajun ($52,325, a difference of 0.27%).
| Demographics | Rating | Rank | Median Male Earnings |
| Immigrants | Uruguay | 16.8 /100 | #202 | Poor $52,860 |
| Panamanians | 16.5 /100 | #203 | Poor $52,835 |
| Ghanaians | 16.1 /100 | #204 | Poor $52,810 |
| Immigrants | Colombia | 15.0 /100 | #205 | Poor $52,725 |
| Immigrants | Iraq | 14.5 /100 | #206 | Poor $52,681 |
| Vietnamese | 12.7 /100 | #207 | Poor $52,525 |
| Venezuelans | 12.5 /100 | #208 | Poor $52,510 |
| Bermudans | 12.1 /100 | #209 | Poor $52,465 |
| Delaware | 11.5 /100 | #210 | Poor $52,412 |
| Tlingit-Haida | 11.5 /100 | #211 | Poor $52,409 |
| Cajuns | 10.7 /100 | #212 | Poor $52,325 |
| Native Hawaiians | 10.5 /100 | #213 | Poor $52,306 |
| Immigrants | Nonimmigrants | 9.3 /100 | #214 | Tragic $52,170 |
| Immigrants | Cameroon | 8.9 /100 | #215 | Tragic $52,119 |
| Immigrants | Venezuela | 8.3 /100 | #216 | Tragic $52,041 |