Maltese vs Dutch 7th Grade
COMPARE
Maltese
Dutch
7th Grade
7th Grade Comparison
Maltese
Dutch
97.1%
7TH GRADE
99.9/ 100
METRIC RATING
43rd/ 347
METRIC RANK
97.9%
7TH GRADE
100.0/ 100
METRIC RATING
5th/ 347
METRIC RANK
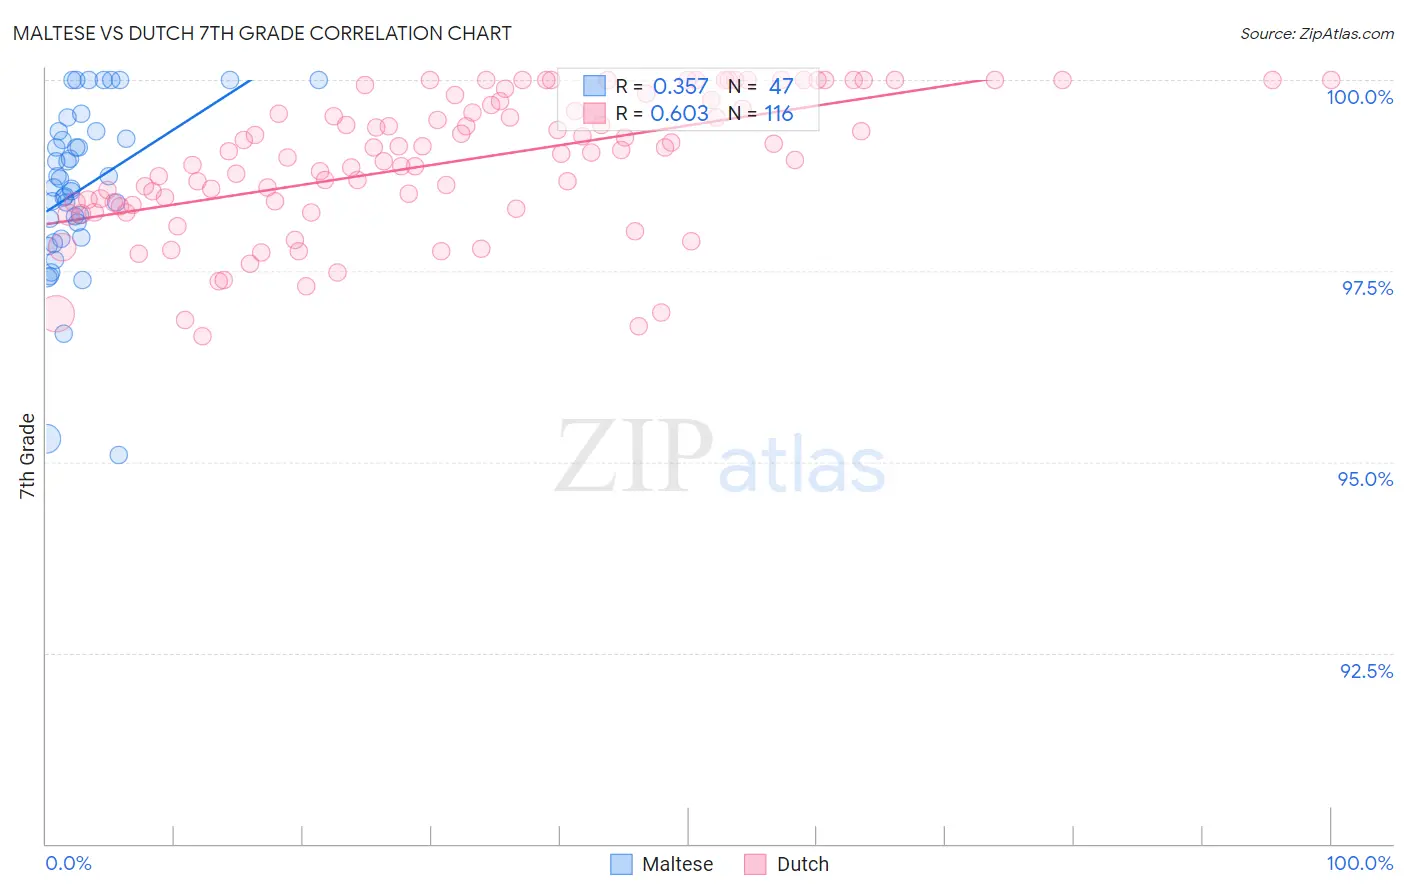
Maltese vs Dutch 7th Grade Correlation Chart
The statistical analysis conducted on geographies consisting of 126,476,608 people shows a mild positive correlation between the proportion of Maltese and percentage of population with at least 7th grade education in the United States with a correlation coefficient (R) of 0.357 and weighted average of 97.1%. Similarly, the statistical analysis conducted on geographies consisting of 361,278,890 people shows a significant positive correlation between the proportion of Dutch and percentage of population with at least 7th grade education in the United States with a correlation coefficient (R) of 0.603 and weighted average of 97.9%, a difference of 0.79%.
7th Grade Correlation Summary
| Measurement | Maltese | Dutch |
| Minimum | 95.1% | 96.6% |
| Maximum | 100.0% | 100.0% |
| Range | 4.9% | 3.4% |
| Mean | 98.6% | 98.9% |
| Median | 98.6% | 99.1% |
| Interquartile 25% (IQ1) | 97.9% | 98.4% |
| Interquartile 75% (IQ3) | 99.3% | 99.7% |
| Interquartile Range (IQR) | 1.4% | 1.3% |
| Standard Deviation (Sample) | 1.1% | 0.88% |
| Standard Deviation (Population) | 1.1% | 0.88% |
Similar Demographics by 7th Grade
Demographics Similar to Maltese by 7th Grade
In terms of 7th grade, the demographic groups most similar to Maltese are Northern European (97.1%, a difference of 0.0%), Czechoslovakian (97.1%, a difference of 0.010%), Aleut (97.1%, a difference of 0.010%), Chinese (97.1%, a difference of 0.030%), and Bulgarian (97.1%, a difference of 0.040%).
| Demographics | Rating | Rank | 7th Grade |
| Hungarians | 100.0 /100 | #36 | Exceptional 97.2% |
| British | 100.0 /100 | #37 | Exceptional 97.2% |
| Belgians | 100.0 /100 | #38 | Exceptional 97.2% |
| Latvians | 100.0 /100 | #39 | Exceptional 97.2% |
| Luxembourgers | 100.0 /100 | #40 | Exceptional 97.2% |
| Eastern Europeans | 100.0 /100 | #41 | Exceptional 97.2% |
| Chinese | 99.9 /100 | #42 | Exceptional 97.1% |
| Maltese | 99.9 /100 | #43 | Exceptional 97.1% |
| Northern Europeans | 99.9 /100 | #44 | Exceptional 97.1% |
| Czechoslovakians | 99.9 /100 | #45 | Exceptional 97.1% |
| Aleuts | 99.9 /100 | #46 | Exceptional 97.1% |
| Bulgarians | 99.9 /100 | #47 | Exceptional 97.1% |
| Celtics | 99.9 /100 | #48 | Exceptional 97.1% |
| Slavs | 99.9 /100 | #49 | Exceptional 97.1% |
| Immigrants | Scotland | 99.9 /100 | #50 | Exceptional 97.1% |
Demographics Similar to Dutch by 7th Grade
In terms of 7th grade, the demographic groups most similar to Dutch are Tsimshian (97.8%, a difference of 0.060%), Norwegian (97.8%, a difference of 0.090%), Slovak (97.8%, a difference of 0.10%), German (97.7%, a difference of 0.13%), and Slovene (97.6%, a difference of 0.23%).
| Demographics | Rating | Rank | 7th Grade |
| Crow | 100.0 /100 | #1 | Exceptional 99.1% |
| Finns | 100.0 /100 | #2 | Exceptional 98.5% |
| Carpatho Rusyns | 100.0 /100 | #3 | Exceptional 98.3% |
| Ottawa | 100.0 /100 | #4 | Exceptional 98.1% |
| Dutch | 100.0 /100 | #5 | Exceptional 97.9% |
| Tsimshian | 100.0 /100 | #6 | Exceptional 97.8% |
| Norwegians | 100.0 /100 | #7 | Exceptional 97.8% |
| Slovaks | 100.0 /100 | #8 | Exceptional 97.8% |
| Germans | 100.0 /100 | #9 | Exceptional 97.7% |
| Slovenes | 100.0 /100 | #10 | Exceptional 97.6% |
| Alaskan Athabascans | 100.0 /100 | #11 | Exceptional 97.6% |
| Poles | 100.0 /100 | #12 | Exceptional 97.6% |
| Swedes | 100.0 /100 | #13 | Exceptional 97.6% |
| Pennsylvania Germans | 100.0 /100 | #14 | Exceptional 97.6% |
| English | 100.0 /100 | #15 | Exceptional 97.6% |