Malaysian vs Liberian Median Male Earnings
COMPARE
Malaysian
Liberian
Median Male Earnings
Median Male Earnings Comparison
Malaysians
Liberians
$50,772
MEDIAN MALE EARNINGS
2.5/ 100
METRIC RATING
238th/ 347
METRIC RANK
$49,318
MEDIAN MALE EARNINGS
0.6/ 100
METRIC RATING
261st/ 347
METRIC RANK
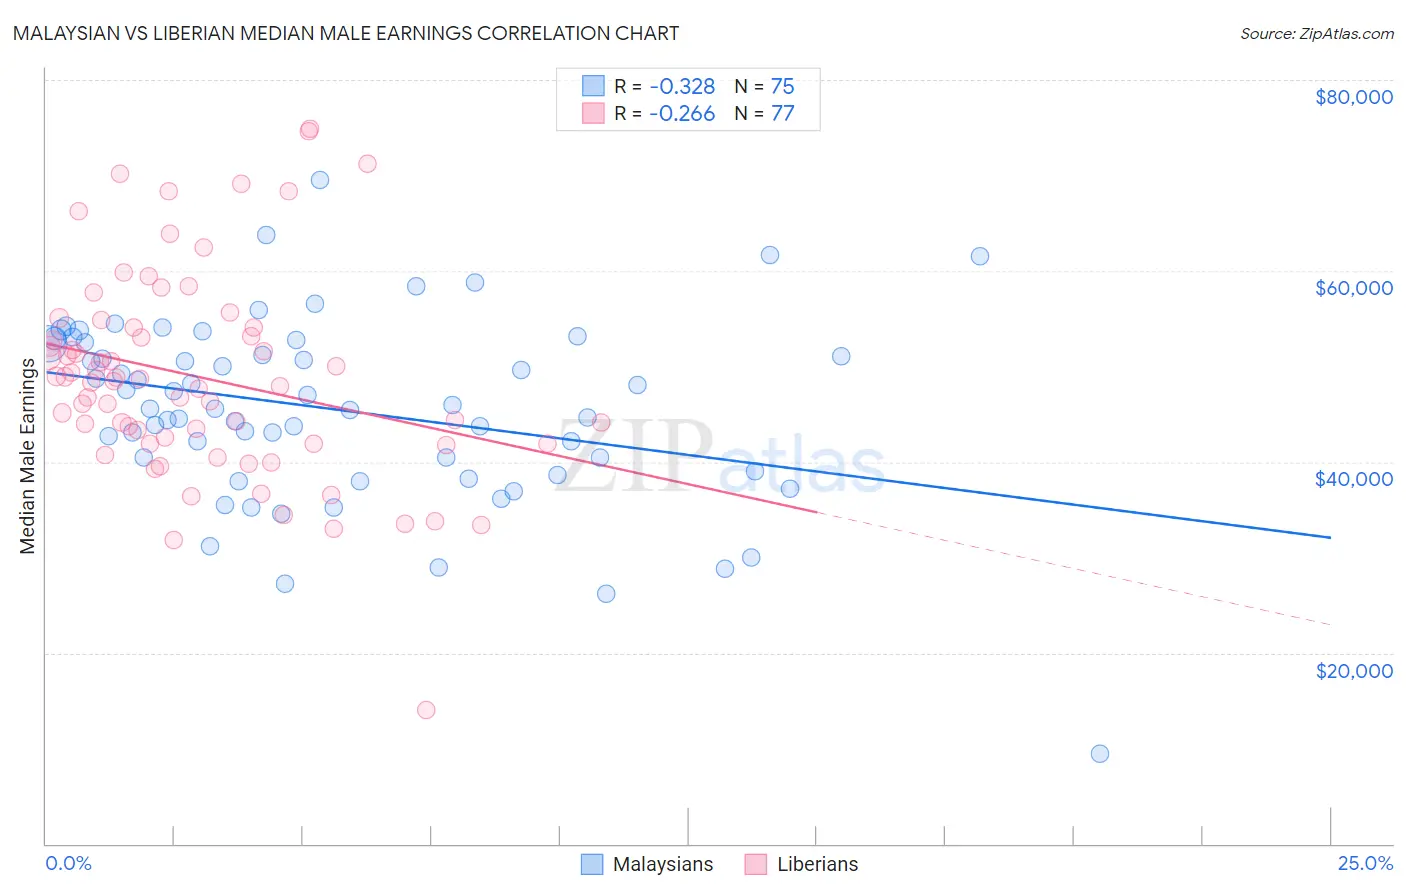
Malaysian vs Liberian Median Male Earnings Correlation Chart
The statistical analysis conducted on geographies consisting of 226,097,760 people shows a mild negative correlation between the proportion of Malaysians and median male earnings in the United States with a correlation coefficient (R) of -0.328 and weighted average of $50,772. Similarly, the statistical analysis conducted on geographies consisting of 118,095,267 people shows a weak negative correlation between the proportion of Liberians and median male earnings in the United States with a correlation coefficient (R) of -0.266 and weighted average of $49,318, a difference of 2.9%.
Median Male Earnings Correlation Summary
| Measurement | Malaysian | Liberian |
| Minimum | $9,476 | $14,075 |
| Maximum | $69,480 | $74,924 |
| Range | $60,004 | $60,849 |
| Mean | $45,460 | $48,884 |
| Median | $45,623 | $48,498 |
| Interquartile 25% (IQ1) | $39,010 | $41,872 |
| Interquartile 75% (IQ3) | $52,552 | $54,038 |
| Interquartile Range (IQR) | $13,542 | $12,166 |
| Standard Deviation (Sample) | $9,782 | $10,904 |
| Standard Deviation (Population) | $9,717 | $10,833 |
Similar Demographics by Median Male Earnings
Demographics Similar to Malaysians by Median Male Earnings
In terms of median male earnings, the demographic groups most similar to Malaysians are American ($50,761, a difference of 0.020%), Immigrants from Barbados ($50,795, a difference of 0.050%), West Indian ($50,682, a difference of 0.18%), Pennsylvania German ($50,878, a difference of 0.21%), and Immigrants from St. Vincent and the Grenadines ($50,665, a difference of 0.21%).
| Demographics | Rating | Rank | Median Male Earnings |
| Barbadians | 3.9 /100 | #231 | Tragic $51,236 |
| Sudanese | 3.9 /100 | #232 | Tragic $51,216 |
| Aleuts | 3.7 /100 | #233 | Tragic $51,168 |
| Cape Verdeans | 3.5 /100 | #234 | Tragic $51,103 |
| Immigrants | Western Africa | 3.0 /100 | #235 | Tragic $50,940 |
| Pennsylvania Germans | 2.8 /100 | #236 | Tragic $50,878 |
| Immigrants | Barbados | 2.6 /100 | #237 | Tragic $50,795 |
| Malaysians | 2.5 /100 | #238 | Tragic $50,772 |
| Americans | 2.5 /100 | #239 | Tragic $50,761 |
| West Indians | 2.3 /100 | #240 | Tragic $50,682 |
| Immigrants | St. Vincent and the Grenadines | 2.3 /100 | #241 | Tragic $50,665 |
| Guyanese | 2.2 /100 | #242 | Tragic $50,613 |
| French American Indians | 2.2 /100 | #243 | Tragic $50,611 |
| Houma | 2.0 /100 | #244 | Tragic $50,547 |
| Hawaiians | 1.9 /100 | #245 | Tragic $50,488 |
Demographics Similar to Liberians by Median Male Earnings
In terms of median male earnings, the demographic groups most similar to Liberians are Immigrants from West Indies ($49,271, a difference of 0.10%), Iroquois ($49,374, a difference of 0.11%), Nicaraguan ($49,215, a difference of 0.21%), Immigrants from Middle Africa ($49,201, a difference of 0.24%), and Immigrants from Laos ($49,190, a difference of 0.26%).
| Demographics | Rating | Rank | Median Male Earnings |
| Senegalese | 1.0 /100 | #254 | Tragic $49,774 |
| Alaskan Athabascans | 0.9 /100 | #255 | Tragic $49,748 |
| Alaska Natives | 0.9 /100 | #256 | Tragic $49,711 |
| British West Indians | 0.8 /100 | #257 | Tragic $49,636 |
| Cree | 0.7 /100 | #258 | Tragic $49,497 |
| Nepalese | 0.7 /100 | #259 | Tragic $49,458 |
| Iroquois | 0.7 /100 | #260 | Tragic $49,374 |
| Liberians | 0.6 /100 | #261 | Tragic $49,318 |
| Immigrants | West Indies | 0.6 /100 | #262 | Tragic $49,271 |
| Nicaraguans | 0.6 /100 | #263 | Tragic $49,215 |
| Immigrants | Middle Africa | 0.6 /100 | #264 | Tragic $49,201 |
| Immigrants | Laos | 0.6 /100 | #265 | Tragic $49,190 |
| Somalis | 0.5 /100 | #266 | Tragic $49,025 |
| Spanish Americans | 0.5 /100 | #267 | Tragic $49,008 |
| Ute | 0.4 /100 | #268 | Tragic $48,899 |