Malaysian vs Immigrants from Croatia Median Male Earnings
COMPARE
Malaysian
Immigrants from Croatia
Median Male Earnings
Median Male Earnings Comparison
Malaysians
Immigrants from Croatia
$50,772
MEDIAN MALE EARNINGS
2.5/ 100
METRIC RATING
238th/ 347
METRIC RANK
$60,914
MEDIAN MALE EARNINGS
99.8/ 100
METRIC RATING
66th/ 347
METRIC RANK
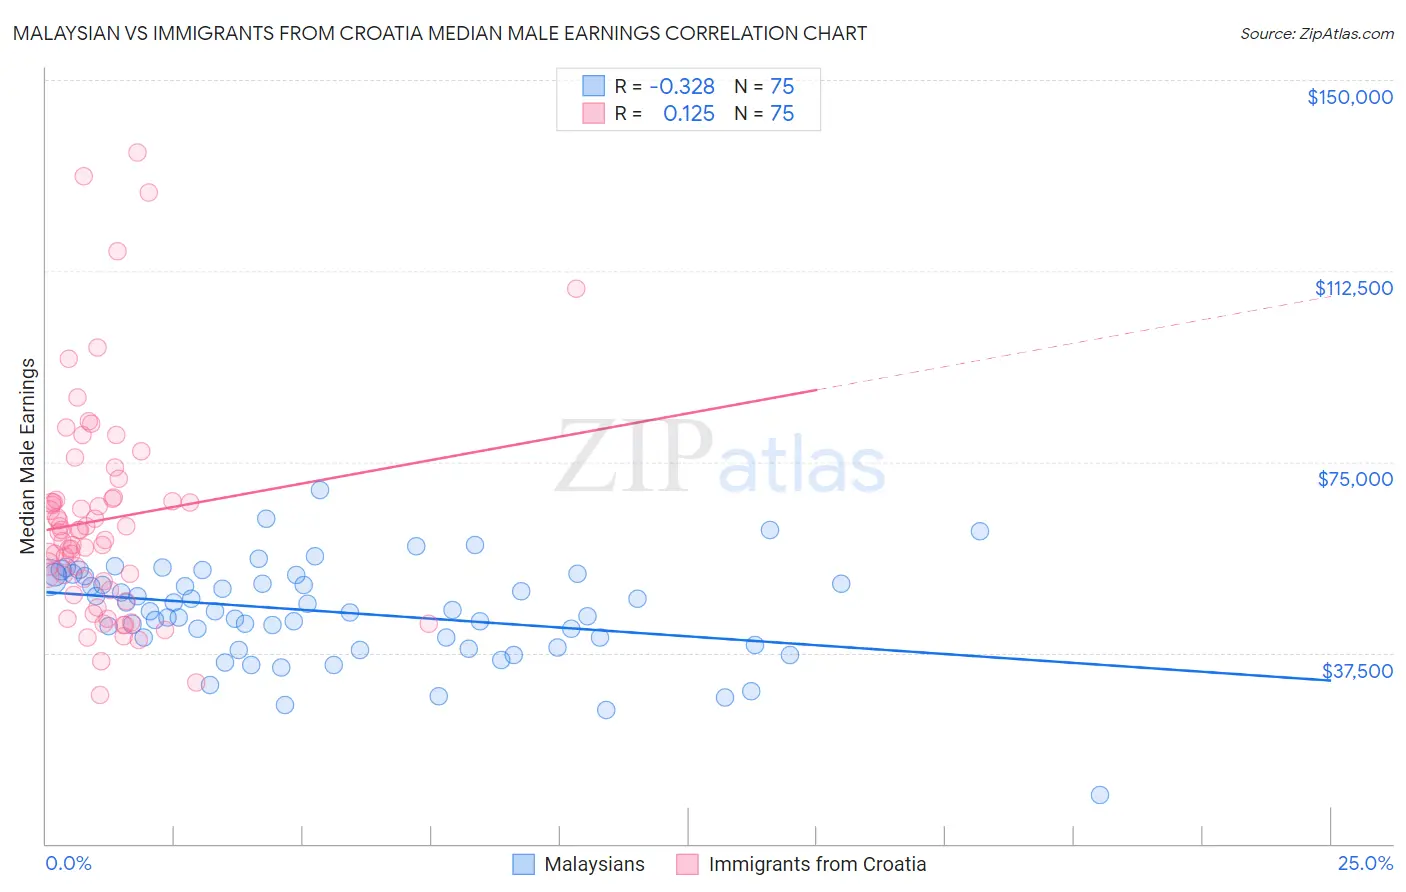
Malaysian vs Immigrants from Croatia Median Male Earnings Correlation Chart
The statistical analysis conducted on geographies consisting of 226,097,760 people shows a mild negative correlation between the proportion of Malaysians and median male earnings in the United States with a correlation coefficient (R) of -0.328 and weighted average of $50,772. Similarly, the statistical analysis conducted on geographies consisting of 132,568,017 people shows a poor positive correlation between the proportion of Immigrants from Croatia and median male earnings in the United States with a correlation coefficient (R) of 0.125 and weighted average of $60,914, a difference of 20.0%.
Median Male Earnings Correlation Summary
| Measurement | Malaysian | Immigrants from Croatia |
| Minimum | $9,476 | $29,220 |
| Maximum | $69,480 | $135,716 |
| Range | $60,004 | $106,496 |
| Mean | $45,460 | $63,717 |
| Median | $45,623 | $61,084 |
| Interquartile 25% (IQ1) | $39,010 | $49,929 |
| Interquartile 75% (IQ3) | $52,552 | $67,721 |
| Interquartile Range (IQR) | $13,542 | $17,792 |
| Standard Deviation (Sample) | $9,782 | $21,463 |
| Standard Deviation (Population) | $9,717 | $21,320 |
Similar Demographics by Median Male Earnings
Demographics Similar to Malaysians by Median Male Earnings
In terms of median male earnings, the demographic groups most similar to Malaysians are American ($50,761, a difference of 0.020%), Immigrants from Barbados ($50,795, a difference of 0.050%), West Indian ($50,682, a difference of 0.18%), Pennsylvania German ($50,878, a difference of 0.21%), and Immigrants from St. Vincent and the Grenadines ($50,665, a difference of 0.21%).
| Demographics | Rating | Rank | Median Male Earnings |
| Barbadians | 3.9 /100 | #231 | Tragic $51,236 |
| Sudanese | 3.9 /100 | #232 | Tragic $51,216 |
| Aleuts | 3.7 /100 | #233 | Tragic $51,168 |
| Cape Verdeans | 3.5 /100 | #234 | Tragic $51,103 |
| Immigrants | Western Africa | 3.0 /100 | #235 | Tragic $50,940 |
| Pennsylvania Germans | 2.8 /100 | #236 | Tragic $50,878 |
| Immigrants | Barbados | 2.6 /100 | #237 | Tragic $50,795 |
| Malaysians | 2.5 /100 | #238 | Tragic $50,772 |
| Americans | 2.5 /100 | #239 | Tragic $50,761 |
| West Indians | 2.3 /100 | #240 | Tragic $50,682 |
| Immigrants | St. Vincent and the Grenadines | 2.3 /100 | #241 | Tragic $50,665 |
| Guyanese | 2.2 /100 | #242 | Tragic $50,613 |
| French American Indians | 2.2 /100 | #243 | Tragic $50,611 |
| Houma | 2.0 /100 | #244 | Tragic $50,547 |
| Hawaiians | 1.9 /100 | #245 | Tragic $50,488 |
Demographics Similar to Immigrants from Croatia by Median Male Earnings
In terms of median male earnings, the demographic groups most similar to Immigrants from Croatia are Immigrants from Indonesia ($60,935, a difference of 0.030%), Immigrants from Eastern Europe ($60,958, a difference of 0.070%), Immigrants from Pakistan ($60,987, a difference of 0.12%), Immigrants from Romania ($61,040, a difference of 0.21%), and Bolivian ($61,066, a difference of 0.25%).
| Demographics | Rating | Rank | Median Male Earnings |
| Immigrants | Netherlands | 99.8 /100 | #59 | Exceptional $61,096 |
| Egyptians | 99.8 /100 | #60 | Exceptional $61,095 |
| Bolivians | 99.8 /100 | #61 | Exceptional $61,066 |
| Immigrants | Romania | 99.8 /100 | #62 | Exceptional $61,040 |
| Immigrants | Pakistan | 99.8 /100 | #63 | Exceptional $60,987 |
| Immigrants | Eastern Europe | 99.8 /100 | #64 | Exceptional $60,958 |
| Immigrants | Indonesia | 99.8 /100 | #65 | Exceptional $60,935 |
| Immigrants | Croatia | 99.8 /100 | #66 | Exceptional $60,914 |
| Immigrants | Spain | 99.8 /100 | #67 | Exceptional $60,750 |
| Immigrants | Serbia | 99.7 /100 | #68 | Exceptional $60,600 |
| Immigrants | Canada | 99.7 /100 | #69 | Exceptional $60,388 |
| Immigrants | Bulgaria | 99.7 /100 | #70 | Exceptional $60,358 |
| Mongolians | 99.7 /100 | #71 | Exceptional $60,350 |
| Immigrants | Western Europe | 99.7 /100 | #72 | Exceptional $60,334 |
| Immigrants | North America | 99.7 /100 | #73 | Exceptional $60,265 |