Malaysian vs Irish Median Male Earnings
COMPARE
Malaysian
Irish
Median Male Earnings
Median Male Earnings Comparison
Malaysians
Irish
$50,772
MEDIAN MALE EARNINGS
2.5/ 100
METRIC RATING
238th/ 347
METRIC RANK
$56,464
MEDIAN MALE EARNINGS
87.4/ 100
METRIC RATING
135th/ 347
METRIC RANK
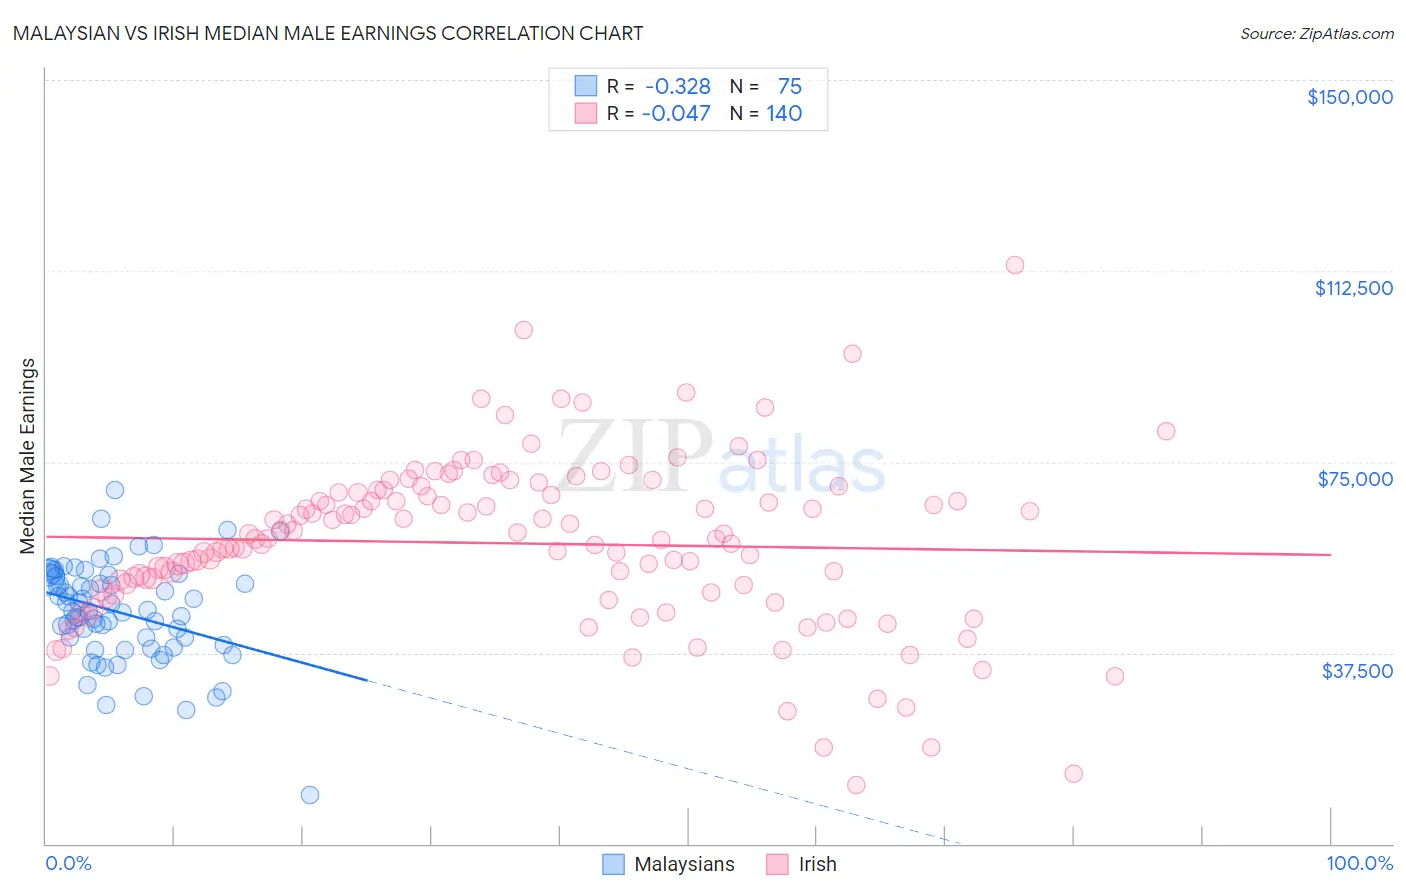
Malaysian vs Irish Median Male Earnings Correlation Chart
The statistical analysis conducted on geographies consisting of 226,097,760 people shows a mild negative correlation between the proportion of Malaysians and median male earnings in the United States with a correlation coefficient (R) of -0.328 and weighted average of $50,772. Similarly, the statistical analysis conducted on geographies consisting of 578,544,263 people shows no correlation between the proportion of Irish and median male earnings in the United States with a correlation coefficient (R) of -0.047 and weighted average of $56,464, a difference of 11.2%.
Median Male Earnings Correlation Summary
| Measurement | Malaysian | Irish |
| Minimum | $9,476 | $11,458 |
| Maximum | $69,480 | $113,788 |
| Range | $60,004 | $102,330 |
| Mean | $45,460 | $59,014 |
| Median | $45,623 | $59,889 |
| Interquartile 25% (IQ1) | $39,010 | $49,565 |
| Interquartile 75% (IQ3) | $52,552 | $68,949 |
| Interquartile Range (IQR) | $13,542 | $19,384 |
| Standard Deviation (Sample) | $9,782 | $16,409 |
| Standard Deviation (Population) | $9,717 | $16,350 |
Similar Demographics by Median Male Earnings
Demographics Similar to Malaysians by Median Male Earnings
In terms of median male earnings, the demographic groups most similar to Malaysians are American ($50,761, a difference of 0.020%), Immigrants from Barbados ($50,795, a difference of 0.050%), West Indian ($50,682, a difference of 0.18%), Pennsylvania German ($50,878, a difference of 0.21%), and Immigrants from St. Vincent and the Grenadines ($50,665, a difference of 0.21%).
| Demographics | Rating | Rank | Median Male Earnings |
| Barbadians | 3.9 /100 | #231 | Tragic $51,236 |
| Sudanese | 3.9 /100 | #232 | Tragic $51,216 |
| Aleuts | 3.7 /100 | #233 | Tragic $51,168 |
| Cape Verdeans | 3.5 /100 | #234 | Tragic $51,103 |
| Immigrants | Western Africa | 3.0 /100 | #235 | Tragic $50,940 |
| Pennsylvania Germans | 2.8 /100 | #236 | Tragic $50,878 |
| Immigrants | Barbados | 2.6 /100 | #237 | Tragic $50,795 |
| Malaysians | 2.5 /100 | #238 | Tragic $50,772 |
| Americans | 2.5 /100 | #239 | Tragic $50,761 |
| West Indians | 2.3 /100 | #240 | Tragic $50,682 |
| Immigrants | St. Vincent and the Grenadines | 2.3 /100 | #241 | Tragic $50,665 |
| Guyanese | 2.2 /100 | #242 | Tragic $50,613 |
| French American Indians | 2.2 /100 | #243 | Tragic $50,611 |
| Houma | 2.0 /100 | #244 | Tragic $50,547 |
| Hawaiians | 1.9 /100 | #245 | Tragic $50,488 |
Demographics Similar to Irish by Median Male Earnings
In terms of median male earnings, the demographic groups most similar to Irish are Immigrants from Saudi Arabia ($56,452, a difference of 0.020%), Moroccan ($56,499, a difference of 0.060%), Slavic ($56,390, a difference of 0.13%), Czech ($56,546, a difference of 0.14%), and Immigrants from Germany ($56,542, a difference of 0.14%).
| Demographics | Rating | Rank | Median Male Earnings |
| Immigrants | Syria | 90.8 /100 | #128 | Exceptional $56,830 |
| Pakistanis | 89.9 /100 | #129 | Excellent $56,719 |
| Koreans | 89.4 /100 | #130 | Excellent $56,672 |
| Portuguese | 89.4 /100 | #131 | Excellent $56,663 |
| Czechs | 88.2 /100 | #132 | Excellent $56,546 |
| Immigrants | Germany | 88.2 /100 | #133 | Excellent $56,542 |
| Moroccans | 87.7 /100 | #134 | Excellent $56,499 |
| Irish | 87.4 /100 | #135 | Excellent $56,464 |
| Immigrants | Saudi Arabia | 87.2 /100 | #136 | Excellent $56,452 |
| Slavs | 86.5 /100 | #137 | Excellent $56,390 |
| Slovaks | 85.5 /100 | #138 | Excellent $56,306 |
| Zimbabweans | 85.5 /100 | #139 | Excellent $56,302 |
| Luxembourgers | 85.5 /100 | #140 | Excellent $56,300 |
| Danes | 84.8 /100 | #141 | Excellent $56,246 |
| Ethiopians | 84.8 /100 | #142 | Excellent $56,243 |