Immigrants from Africa vs Ecuadorian Per Capita Income
COMPARE
Immigrants from Africa
Ecuadorian
Per Capita Income
Per Capita Income Comparison
Immigrants from Africa
Ecuadorians
$42,950
PER CAPITA INCOME
31.0/ 100
METRIC RATING
188th/ 347
METRIC RANK
$41,958
PER CAPITA INCOME
12.9/ 100
METRIC RATING
210th/ 347
METRIC RANK
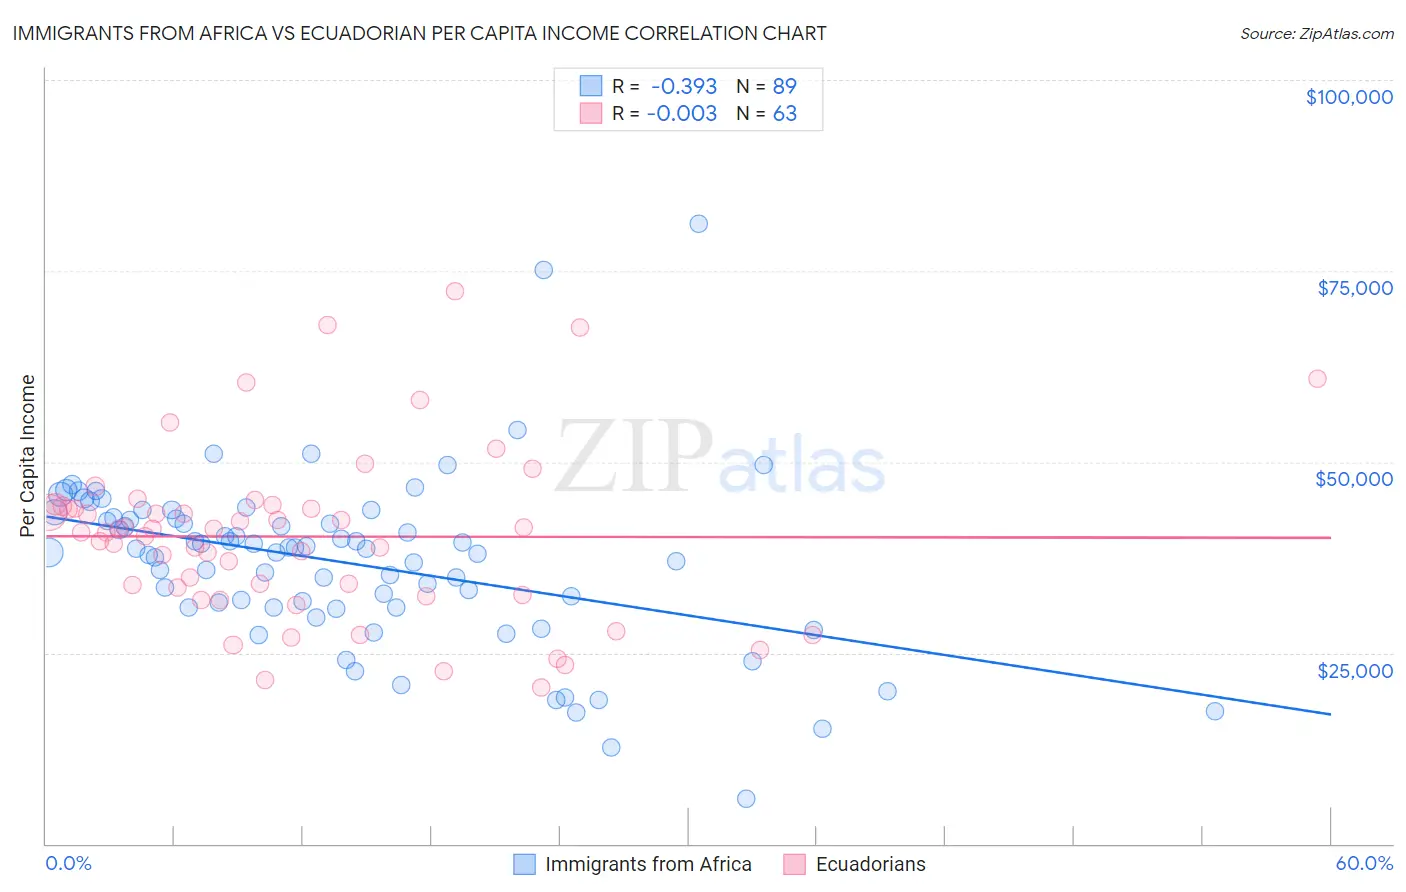
Immigrants from Africa vs Ecuadorian Per Capita Income Correlation Chart
The statistical analysis conducted on geographies consisting of 469,482,271 people shows a mild negative correlation between the proportion of Immigrants from Africa and per capita income in the United States with a correlation coefficient (R) of -0.393 and weighted average of $42,950. Similarly, the statistical analysis conducted on geographies consisting of 317,868,656 people shows no correlation between the proportion of Ecuadorians and per capita income in the United States with a correlation coefficient (R) of -0.003 and weighted average of $41,958, a difference of 2.4%.
Per Capita Income Correlation Summary
| Measurement | Immigrants from Africa | Ecuadorian |
| Minimum | $5,866 | $20,380 |
| Maximum | $81,151 | $72,406 |
| Range | $75,285 | $52,026 |
| Mean | $36,831 | $40,218 |
| Median | $38,619 | $40,771 |
| Interquartile 25% (IQ1) | $30,955 | $32,581 |
| Interquartile 75% (IQ3) | $42,606 | $44,161 |
| Interquartile Range (IQR) | $11,650 | $11,580 |
| Standard Deviation (Sample) | $11,377 | $11,145 |
| Standard Deviation (Population) | $11,312 | $11,056 |
Similar Demographics by Per Capita Income
Demographics Similar to Immigrants from Africa by Per Capita Income
In terms of per capita income, the demographic groups most similar to Immigrants from Africa are Immigrants from Colombia ($42,971, a difference of 0.050%), Bermudan ($42,911, a difference of 0.090%), French Canadian ($43,003, a difference of 0.12%), Immigrants ($43,010, a difference of 0.14%), and Spaniard ($43,028, a difference of 0.18%).
| Demographics | Rating | Rank | Per Capita Income |
| Welsh | 38.2 /100 | #181 | Fair $43,233 |
| Immigrants | Vietnam | 38.1 /100 | #182 | Fair $43,229 |
| Germans | 33.9 /100 | #183 | Fair $43,067 |
| Spaniards | 32.9 /100 | #184 | Fair $43,028 |
| Immigrants | Immigrants | 32.5 /100 | #185 | Fair $43,010 |
| French Canadians | 32.3 /100 | #186 | Fair $43,003 |
| Immigrants | Colombia | 31.5 /100 | #187 | Fair $42,971 |
| Immigrants | Africa | 31.0 /100 | #188 | Fair $42,950 |
| Bermudans | 30.1 /100 | #189 | Fair $42,911 |
| Kenyans | 27.7 /100 | #190 | Fair $42,808 |
| Yugoslavians | 27.4 /100 | #191 | Fair $42,792 |
| Iraqis | 26.7 /100 | #192 | Fair $42,760 |
| Immigrants | Sierra Leone | 26.5 /100 | #193 | Fair $42,752 |
| Immigrants | Fiji | 25.2 /100 | #194 | Fair $42,694 |
| Immigrants | Kenya | 24.5 /100 | #195 | Fair $42,661 |
Demographics Similar to Ecuadorians by Per Capita Income
In terms of per capita income, the demographic groups most similar to Ecuadorians are Immigrants from Sudan ($41,986, a difference of 0.070%), Panamanian ($42,035, a difference of 0.18%), Immigrants from Panama ($41,853, a difference of 0.25%), Venezuelan ($42,074, a difference of 0.28%), and Immigrants from Senegal ($41,830, a difference of 0.30%).
| Demographics | Rating | Rank | Per Capita Income |
| Spanish | 17.0 /100 | #203 | Poor $42,249 |
| Aleuts | 16.4 /100 | #204 | Poor $42,210 |
| Whites/Caucasians | 15.9 /100 | #205 | Poor $42,180 |
| Ghanaians | 15.7 /100 | #206 | Poor $42,164 |
| Venezuelans | 14.4 /100 | #207 | Poor $42,074 |
| Panamanians | 13.9 /100 | #208 | Poor $42,035 |
| Immigrants | Sudan | 13.2 /100 | #209 | Poor $41,986 |
| Ecuadorians | 12.9 /100 | #210 | Poor $41,958 |
| Immigrants | Panama | 11.6 /100 | #211 | Poor $41,853 |
| Immigrants | Senegal | 11.3 /100 | #212 | Poor $41,830 |
| Immigrants | Venezuela | 10.2 /100 | #213 | Poor $41,727 |
| Immigrants | Bangladesh | 10.1 /100 | #214 | Poor $41,709 |
| Sudanese | 9.9 /100 | #215 | Tragic $41,695 |
| Tongans | 9.9 /100 | #216 | Tragic $41,693 |
| Guamanians/Chamorros | 9.7 /100 | #217 | Tragic $41,678 |