Immigrants from Kenya vs Liberian Median Earnings
COMPARE
Immigrants from Kenya
Liberian
Median Earnings
Median Earnings Comparison
Immigrants from Kenya
Liberians
$46,214
MEDIAN EARNINGS
42.4/ 100
METRIC RATING
184th/ 347
METRIC RANK
$43,536
MEDIAN EARNINGS
1.7/ 100
METRIC RATING
254th/ 347
METRIC RANK
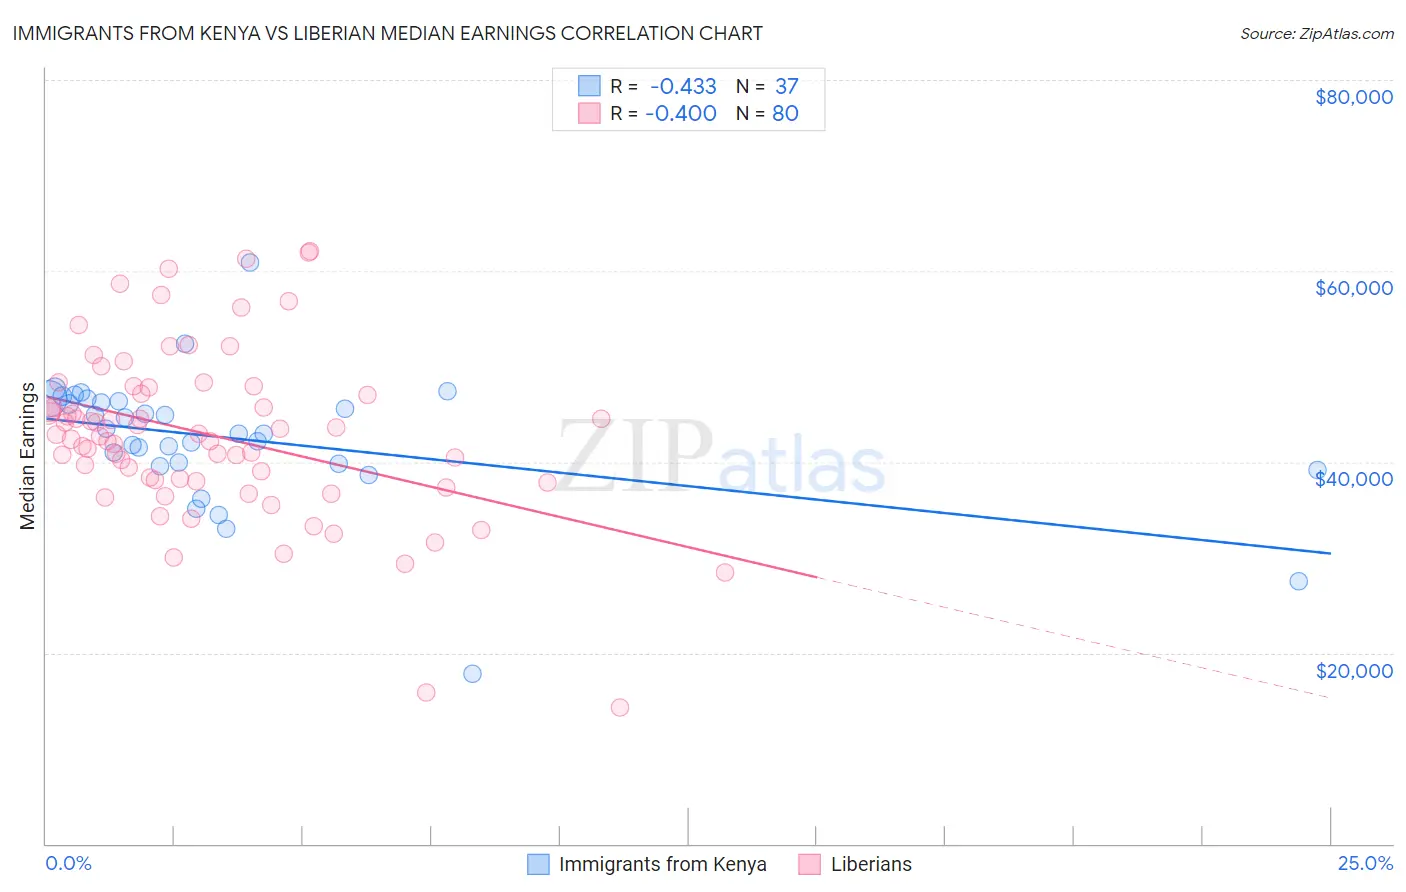
Immigrants from Kenya vs Liberian Median Earnings Correlation Chart
The statistical analysis conducted on geographies consisting of 218,063,953 people shows a moderate negative correlation between the proportion of Immigrants from Kenya and median earnings in the United States with a correlation coefficient (R) of -0.433 and weighted average of $46,214. Similarly, the statistical analysis conducted on geographies consisting of 118,107,140 people shows a mild negative correlation between the proportion of Liberians and median earnings in the United States with a correlation coefficient (R) of -0.400 and weighted average of $43,536, a difference of 6.1%.
Median Earnings Correlation Summary
| Measurement | Immigrants from Kenya | Liberian |
| Minimum | $17,794 | $14,336 |
| Maximum | $60,938 | $62,030 |
| Range | $43,144 | $47,694 |
| Mean | $42,338 | $42,795 |
| Median | $42,995 | $42,751 |
| Interquartile 25% (IQ1) | $39,646 | $38,041 |
| Interquartile 75% (IQ3) | $46,440 | $47,442 |
| Interquartile Range (IQR) | $6,794 | $9,402 |
| Standard Deviation (Sample) | $7,069 | $8,910 |
| Standard Deviation (Population) | $6,973 | $8,855 |
Similar Demographics by Median Earnings
Demographics Similar to Immigrants from Kenya by Median Earnings
In terms of median earnings, the demographic groups most similar to Immigrants from Kenya are Uruguayan ($46,190, a difference of 0.050%), Vietnamese ($46,172, a difference of 0.090%), Iraqi ($46,140, a difference of 0.16%), French ($46,296, a difference of 0.18%), and Swiss ($46,315, a difference of 0.22%).
| Demographics | Rating | Rank | Median Earnings |
| Belgians | 48.0 /100 | #177 | Average $46,375 |
| Colombians | 47.1 /100 | #178 | Average $46,349 |
| English | 46.5 /100 | #179 | Average $46,334 |
| Puget Sound Salish | 46.5 /100 | #180 | Average $46,333 |
| Immigrants | Cameroon | 46.4 /100 | #181 | Average $46,329 |
| Swiss | 45.9 /100 | #182 | Average $46,315 |
| French | 45.2 /100 | #183 | Average $46,296 |
| Immigrants | Kenya | 42.4 /100 | #184 | Average $46,214 |
| Uruguayans | 41.6 /100 | #185 | Average $46,190 |
| Vietnamese | 40.9 /100 | #186 | Average $46,172 |
| Iraqis | 39.9 /100 | #187 | Fair $46,140 |
| Immigrants | Armenia | 38.3 /100 | #188 | Fair $46,094 |
| Spaniards | 37.2 /100 | #189 | Fair $46,059 |
| French Canadians | 36.1 /100 | #190 | Fair $46,026 |
| Finns | 33.4 /100 | #191 | Fair $45,940 |
Demographics Similar to Liberians by Median Earnings
In terms of median earnings, the demographic groups most similar to Liberians are Somali ($43,567, a difference of 0.070%), Immigrants from Middle Africa ($43,416, a difference of 0.28%), Hawaiian ($43,673, a difference of 0.31%), Alaskan Athabascan ($43,393, a difference of 0.33%), and Tsimshian ($43,695, a difference of 0.37%).
| Demographics | Rating | Rank | Median Earnings |
| Immigrants | Cabo Verde | 3.0 /100 | #247 | Tragic $43,963 |
| Nepalese | 2.6 /100 | #248 | Tragic $43,860 |
| Malaysians | 2.6 /100 | #249 | Tragic $43,844 |
| Alaska Natives | 2.3 /100 | #250 | Tragic $43,750 |
| Tsimshian | 2.1 /100 | #251 | Tragic $43,695 |
| Hawaiians | 2.0 /100 | #252 | Tragic $43,673 |
| Somalis | 1.8 /100 | #253 | Tragic $43,567 |
| Liberians | 1.7 /100 | #254 | Tragic $43,536 |
| Immigrants | Middle Africa | 1.4 /100 | #255 | Tragic $43,416 |
| Alaskan Athabascans | 1.4 /100 | #256 | Tragic $43,393 |
| Jamaicans | 1.3 /100 | #257 | Tragic $43,343 |
| French American Indians | 1.3 /100 | #258 | Tragic $43,333 |
| German Russians | 1.1 /100 | #259 | Tragic $43,200 |
| Immigrants | Somalia | 0.9 /100 | #260 | Tragic $43,100 |
| Immigrants | Jamaica | 0.8 /100 | #261 | Tragic $43,026 |