Luxembourger vs Liberian Single Father Households
COMPARE
Luxembourger
Liberian
Single Father Households
Single Father Households Comparison
Luxembourgers
Liberians
2.2%
SINGLE FATHER HOUSEHOLDS
92.3/ 100
METRIC RATING
142nd/ 347
METRIC RANK
2.5%
SINGLE FATHER HOUSEHOLDS
2.0/ 100
METRIC RATING
251st/ 347
METRIC RANK
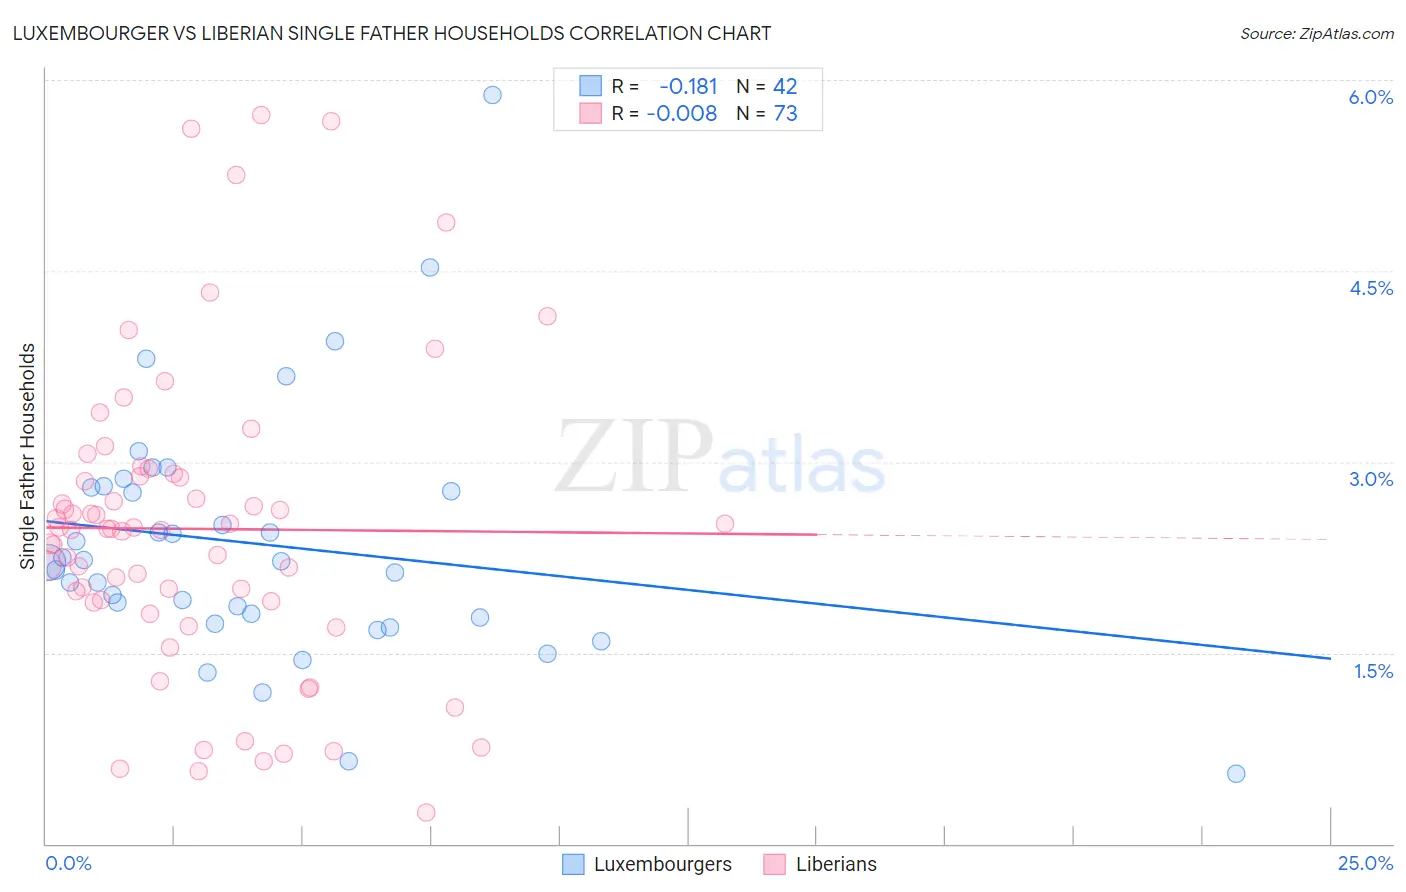
Luxembourger vs Liberian Single Father Households Correlation Chart
The statistical analysis conducted on geographies consisting of 143,992,670 people shows a poor negative correlation between the proportion of Luxembourgers and percentage of single father households in the United States with a correlation coefficient (R) of -0.181 and weighted average of 2.2%. Similarly, the statistical analysis conducted on geographies consisting of 117,831,420 people shows no correlation between the proportion of Liberians and percentage of single father households in the United States with a correlation coefficient (R) of -0.008 and weighted average of 2.5%, a difference of 12.3%.
Single Father Households Correlation Summary
| Measurement | Luxembourger | Liberian |
| Minimum | 0.55% | 0.24% |
| Maximum | 5.9% | 5.7% |
| Range | 5.3% | 5.5% |
| Mean | 2.4% | 2.5% |
| Median | 2.2% | 2.5% |
| Interquartile 25% (IQ1) | 1.8% | 1.9% |
| Interquartile 75% (IQ3) | 2.8% | 2.9% |
| Interquartile Range (IQR) | 1.0% | 0.99% |
| Standard Deviation (Sample) | 0.98% | 1.2% |
| Standard Deviation (Population) | 0.97% | 1.2% |
Similar Demographics by Single Father Households
Demographics Similar to Luxembourgers by Single Father Households
In terms of single father households, the demographic groups most similar to Luxembourgers are Laotian (2.2%, a difference of 0.040%), Immigrants from Nepal (2.2%, a difference of 0.060%), Brazilian (2.2%, a difference of 0.13%), British (2.2%, a difference of 0.13%), and Slovak (2.2%, a difference of 0.40%).
| Demographics | Rating | Rank | Single Father Households |
| Syrians | 94.8 /100 | #135 | Exceptional 2.2% |
| Chileans | 94.5 /100 | #136 | Exceptional 2.2% |
| Austrians | 94.2 /100 | #137 | Exceptional 2.2% |
| West Indians | 94.1 /100 | #138 | Exceptional 2.2% |
| Brazilians | 92.8 /100 | #139 | Exceptional 2.2% |
| British | 92.8 /100 | #140 | Exceptional 2.2% |
| Laotians | 92.5 /100 | #141 | Exceptional 2.2% |
| Luxembourgers | 92.3 /100 | #142 | Exceptional 2.2% |
| Immigrants | Nepal | 92.1 /100 | #143 | Exceptional 2.2% |
| Slovaks | 90.7 /100 | #144 | Exceptional 2.2% |
| Immigrants | Zimbabwe | 90.2 /100 | #145 | Exceptional 2.2% |
| Northern Europeans | 89.8 /100 | #146 | Excellent 2.2% |
| Slavs | 88.9 /100 | #147 | Excellent 2.2% |
| South American Indians | 88.5 /100 | #148 | Excellent 2.3% |
| Senegalese | 88.4 /100 | #149 | Excellent 2.3% |
Demographics Similar to Liberians by Single Father Households
In terms of single father households, the demographic groups most similar to Liberians are Immigrants from Eritrea (2.5%, a difference of 0.020%), Somali (2.5%, a difference of 0.090%), Immigrants from Somalia (2.5%, a difference of 0.090%), Immigrants from Thailand (2.5%, a difference of 0.13%), and Immigrants from Cameroon (2.5%, a difference of 0.26%).
| Demographics | Rating | Rank | Single Father Households |
| Immigrants | Middle Africa | 2.8 /100 | #244 | Tragic 2.5% |
| Basques | 2.5 /100 | #245 | Tragic 2.5% |
| Native Hawaiians | 2.5 /100 | #246 | Tragic 2.5% |
| Delaware | 2.5 /100 | #247 | Tragic 2.5% |
| Bahamians | 2.4 /100 | #248 | Tragic 2.5% |
| Immigrants | Cameroon | 2.3 /100 | #249 | Tragic 2.5% |
| Somalis | 2.1 /100 | #250 | Tragic 2.5% |
| Liberians | 2.0 /100 | #251 | Tragic 2.5% |
| Immigrants | Eritrea | 2.0 /100 | #252 | Tragic 2.5% |
| Immigrants | Somalia | 1.9 /100 | #253 | Tragic 2.5% |
| Immigrants | Thailand | 1.8 /100 | #254 | Tragic 2.5% |
| Tongans | 1.5 /100 | #255 | Tragic 2.5% |
| Potawatomi | 1.4 /100 | #256 | Tragic 2.5% |
| Immigrants | Congo | 1.2 /100 | #257 | Tragic 2.5% |
| Spanish | 1.1 /100 | #258 | Tragic 2.5% |