Lumbee vs Immigrants from Senegal Median Male Earnings
COMPARE
Lumbee
Immigrants from Senegal
Median Male Earnings
Median Male Earnings Comparison
Lumbee
Immigrants from Senegal
$41,715
MEDIAN MALE EARNINGS
0.0/ 100
METRIC RATING
343rd/ 347
METRIC RANK
$51,647
MEDIAN MALE EARNINGS
5.8/ 100
METRIC RATING
221st/ 347
METRIC RANK
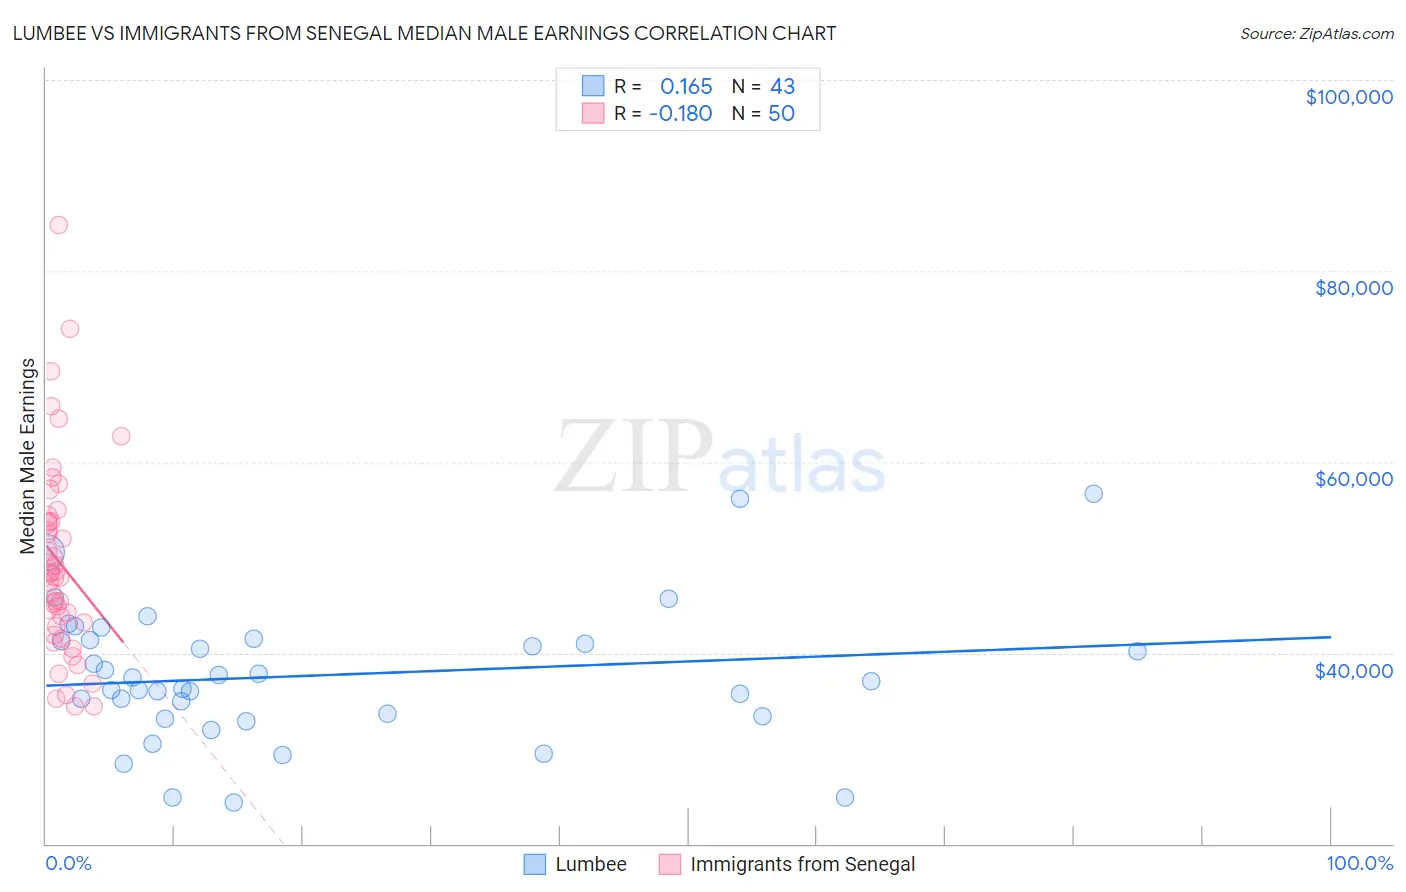
Lumbee vs Immigrants from Senegal Median Male Earnings Correlation Chart
The statistical analysis conducted on geographies consisting of 92,276,202 people shows a poor positive correlation between the proportion of Lumbee and median male earnings in the United States with a correlation coefficient (R) of 0.165 and weighted average of $41,715. Similarly, the statistical analysis conducted on geographies consisting of 90,120,313 people shows a poor negative correlation between the proportion of Immigrants from Senegal and median male earnings in the United States with a correlation coefficient (R) of -0.180 and weighted average of $51,647, a difference of 23.8%.
Median Male Earnings Correlation Summary
| Measurement | Lumbee | Immigrants from Senegal |
| Minimum | $24,297 | $34,387 |
| Maximum | $56,719 | $84,866 |
| Range | $32,422 | $50,479 |
| Mean | $37,623 | $49,446 |
| Median | $37,072 | $48,099 |
| Interquartile 25% (IQ1) | $33,323 | $42,790 |
| Interquartile 75% (IQ3) | $41,323 | $53,838 |
| Interquartile Range (IQR) | $8,000 | $11,049 |
| Standard Deviation (Sample) | $7,117 | $10,360 |
| Standard Deviation (Population) | $7,034 | $10,256 |
Similar Demographics by Median Male Earnings
Demographics Similar to Lumbee by Median Male Earnings
In terms of median male earnings, the demographic groups most similar to Lumbee are Arapaho ($41,758, a difference of 0.10%), Hopi ($42,060, a difference of 0.83%), Navajo ($42,098, a difference of 0.92%), Pueblo ($41,314, a difference of 0.97%), and Pima ($42,357, a difference of 1.5%).
| Demographics | Rating | Rank | Median Male Earnings |
| Immigrants | Congo | 0.0 /100 | #333 | Tragic $44,204 |
| Immigrants | Yemen | 0.0 /100 | #334 | Tragic $44,083 |
| Spanish American Indians | 0.0 /100 | #335 | Tragic $44,010 |
| Immigrants | Cuba | 0.0 /100 | #336 | Tragic $43,461 |
| Menominee | 0.0 /100 | #337 | Tragic $42,581 |
| Crow | 0.0 /100 | #338 | Tragic $42,434 |
| Pima | 0.0 /100 | #339 | Tragic $42,357 |
| Navajo | 0.0 /100 | #340 | Tragic $42,098 |
| Hopi | 0.0 /100 | #341 | Tragic $42,060 |
| Arapaho | 0.0 /100 | #342 | Tragic $41,758 |
| Lumbee | 0.0 /100 | #343 | Tragic $41,715 |
| Pueblo | 0.0 /100 | #344 | Tragic $41,314 |
| Puerto Ricans | 0.0 /100 | #345 | Tragic $40,071 |
| Tohono O'odham | 0.0 /100 | #346 | Tragic $39,543 |
| Yup'ik | 0.0 /100 | #347 | Tragic $39,504 |
Demographics Similar to Immigrants from Senegal by Median Male Earnings
In terms of median male earnings, the demographic groups most similar to Immigrants from Senegal are Immigrants from Bangladesh ($51,642, a difference of 0.010%), Ecuadorian ($51,596, a difference of 0.10%), Immigrants from Cambodia ($51,594, a difference of 0.10%), Immigrants from Armenia ($51,793, a difference of 0.28%), and Immigrants from Sudan ($51,489, a difference of 0.31%).
| Demographics | Rating | Rank | Median Male Earnings |
| Immigrants | Nonimmigrants | 9.3 /100 | #214 | Tragic $52,170 |
| Immigrants | Cameroon | 8.9 /100 | #215 | Tragic $52,119 |
| Immigrants | Venezuela | 8.3 /100 | #216 | Tragic $52,041 |
| Nigerians | 8.3 /100 | #217 | Tragic $52,039 |
| Immigrants | Panama | 7.7 /100 | #218 | Tragic $51,962 |
| Immigrants | Ghana | 6.9 /100 | #219 | Tragic $51,836 |
| Immigrants | Armenia | 6.6 /100 | #220 | Tragic $51,793 |
| Immigrants | Senegal | 5.8 /100 | #221 | Tragic $51,647 |
| Immigrants | Bangladesh | 5.8 /100 | #222 | Tragic $51,642 |
| Ecuadorians | 5.5 /100 | #223 | Tragic $51,596 |
| Immigrants | Cambodia | 5.5 /100 | #224 | Tragic $51,594 |
| Immigrants | Sudan | 5.0 /100 | #225 | Tragic $51,489 |
| Japanese | 4.9 /100 | #226 | Tragic $51,473 |
| Trinidadians and Tobagonians | 4.8 /100 | #227 | Tragic $51,446 |
| Samoans | 4.6 /100 | #228 | Tragic $51,389 |