Lumbee vs Immigrants from Turkey Median Male Earnings
COMPARE
Lumbee
Immigrants from Turkey
Median Male Earnings
Median Male Earnings Comparison
Lumbee
Immigrants from Turkey
$41,715
MEDIAN MALE EARNINGS
0.0/ 100
METRIC RATING
343rd/ 347
METRIC RANK
$62,728
MEDIAN MALE EARNINGS
100.0/ 100
METRIC RATING
41st/ 347
METRIC RANK
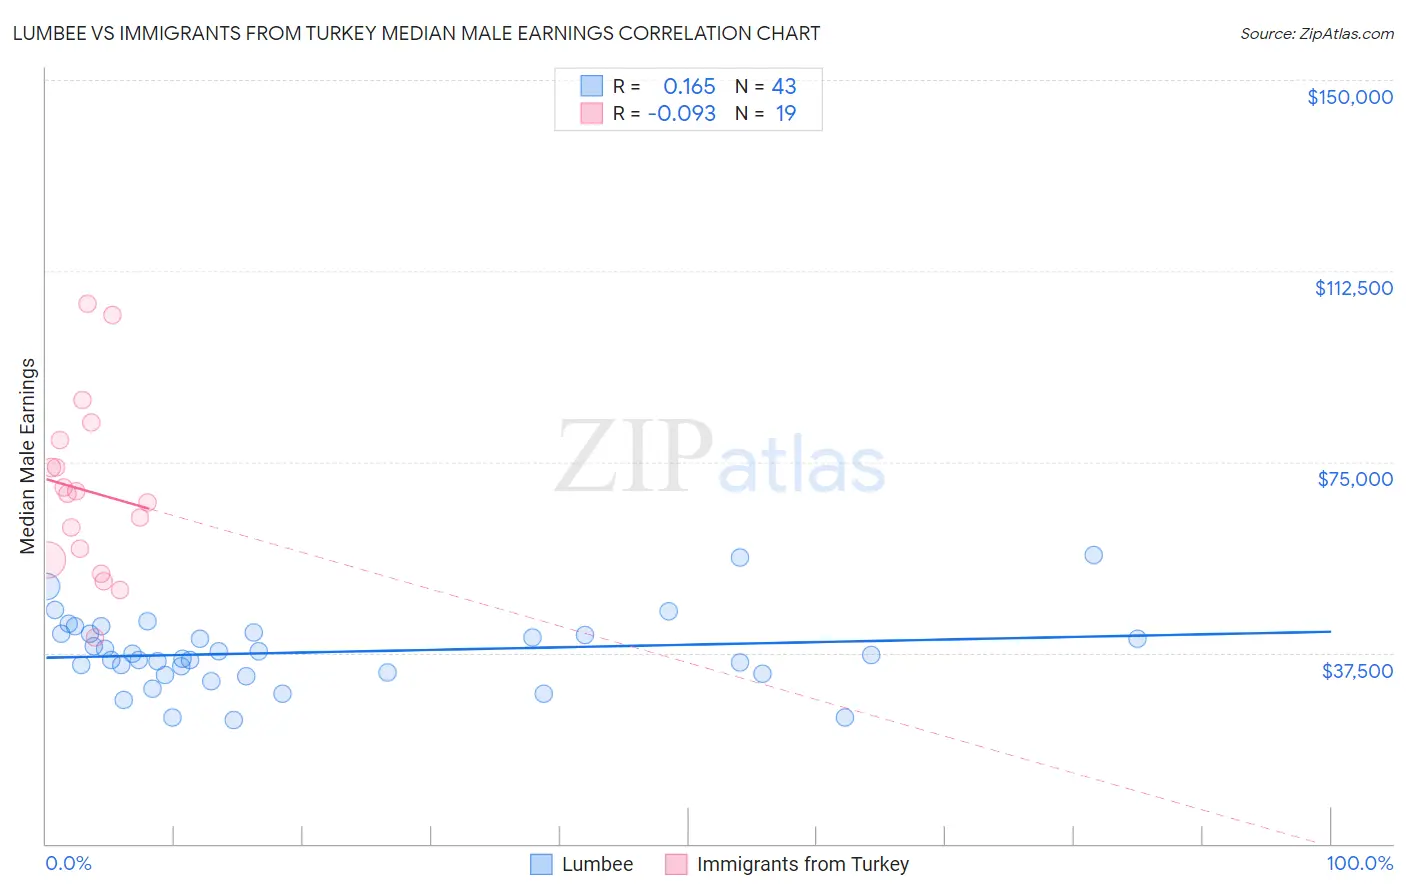
Lumbee vs Immigrants from Turkey Median Male Earnings Correlation Chart
The statistical analysis conducted on geographies consisting of 92,276,202 people shows a poor positive correlation between the proportion of Lumbee and median male earnings in the United States with a correlation coefficient (R) of 0.165 and weighted average of $41,715. Similarly, the statistical analysis conducted on geographies consisting of 223,034,216 people shows a slight negative correlation between the proportion of Immigrants from Turkey and median male earnings in the United States with a correlation coefficient (R) of -0.093 and weighted average of $62,728, a difference of 50.4%.
Median Male Earnings Correlation Summary
| Measurement | Lumbee | Immigrants from Turkey |
| Minimum | $24,297 | $40,469 |
| Maximum | $56,719 | $106,104 |
| Range | $32,422 | $65,635 |
| Mean | $37,623 | $69,295 |
| Median | $37,072 | $68,821 |
| Interquartile 25% (IQ1) | $33,323 | $55,843 |
| Interquartile 75% (IQ3) | $41,323 | $79,397 |
| Interquartile Range (IQR) | $8,000 | $23,554 |
| Standard Deviation (Sample) | $7,117 | $17,281 |
| Standard Deviation (Population) | $7,034 | $16,820 |
Similar Demographics by Median Male Earnings
Demographics Similar to Lumbee by Median Male Earnings
In terms of median male earnings, the demographic groups most similar to Lumbee are Arapaho ($41,758, a difference of 0.10%), Hopi ($42,060, a difference of 0.83%), Navajo ($42,098, a difference of 0.92%), Pueblo ($41,314, a difference of 0.97%), and Pima ($42,357, a difference of 1.5%).
| Demographics | Rating | Rank | Median Male Earnings |
| Immigrants | Congo | 0.0 /100 | #333 | Tragic $44,204 |
| Immigrants | Yemen | 0.0 /100 | #334 | Tragic $44,083 |
| Spanish American Indians | 0.0 /100 | #335 | Tragic $44,010 |
| Immigrants | Cuba | 0.0 /100 | #336 | Tragic $43,461 |
| Menominee | 0.0 /100 | #337 | Tragic $42,581 |
| Crow | 0.0 /100 | #338 | Tragic $42,434 |
| Pima | 0.0 /100 | #339 | Tragic $42,357 |
| Navajo | 0.0 /100 | #340 | Tragic $42,098 |
| Hopi | 0.0 /100 | #341 | Tragic $42,060 |
| Arapaho | 0.0 /100 | #342 | Tragic $41,758 |
| Lumbee | 0.0 /100 | #343 | Tragic $41,715 |
| Pueblo | 0.0 /100 | #344 | Tragic $41,314 |
| Puerto Ricans | 0.0 /100 | #345 | Tragic $40,071 |
| Tohono O'odham | 0.0 /100 | #346 | Tragic $39,543 |
| Yup'ik | 0.0 /100 | #347 | Tragic $39,504 |
Demographics Similar to Immigrants from Turkey by Median Male Earnings
In terms of median male earnings, the demographic groups most similar to Immigrants from Turkey are Immigrants from Greece ($62,689, a difference of 0.060%), Immigrants from Belarus ($62,658, a difference of 0.11%), Australian ($62,857, a difference of 0.21%), Immigrants from South Africa ($62,899, a difference of 0.27%), and Cambodian ($62,516, a difference of 0.34%).
| Demographics | Rating | Rank | Median Male Earnings |
| Immigrants | Russia | 100.0 /100 | #34 | Exceptional $63,326 |
| Immigrants | Asia | 100.0 /100 | #35 | Exceptional $63,240 |
| Israelis | 100.0 /100 | #36 | Exceptional $63,228 |
| Immigrants | Sri Lanka | 100.0 /100 | #37 | Exceptional $63,099 |
| Maltese | 100.0 /100 | #38 | Exceptional $62,953 |
| Immigrants | South Africa | 100.0 /100 | #39 | Exceptional $62,899 |
| Australians | 100.0 /100 | #40 | Exceptional $62,857 |
| Immigrants | Turkey | 100.0 /100 | #41 | Exceptional $62,728 |
| Immigrants | Greece | 100.0 /100 | #42 | Exceptional $62,689 |
| Immigrants | Belarus | 100.0 /100 | #43 | Exceptional $62,658 |
| Cambodians | 100.0 /100 | #44 | Exceptional $62,516 |
| Bulgarians | 100.0 /100 | #45 | Exceptional $62,378 |
| Immigrants | Czechoslovakia | 99.9 /100 | #46 | Exceptional $62,217 |
| Immigrants | Austria | 99.9 /100 | #47 | Exceptional $62,164 |
| Immigrants | Malaysia | 99.9 /100 | #48 | Exceptional $62,121 |