Lumbee vs Immigrants from Cabo Verde Median Male Earnings
COMPARE
Lumbee
Immigrants from Cabo Verde
Median Male Earnings
Median Male Earnings Comparison
Lumbee
Immigrants from Cabo Verde
$41,715
MEDIAN MALE EARNINGS
0.0/ 100
METRIC RATING
343rd/ 347
METRIC RANK
$50,009
MEDIAN MALE EARNINGS
1.2/ 100
METRIC RATING
252nd/ 347
METRIC RANK
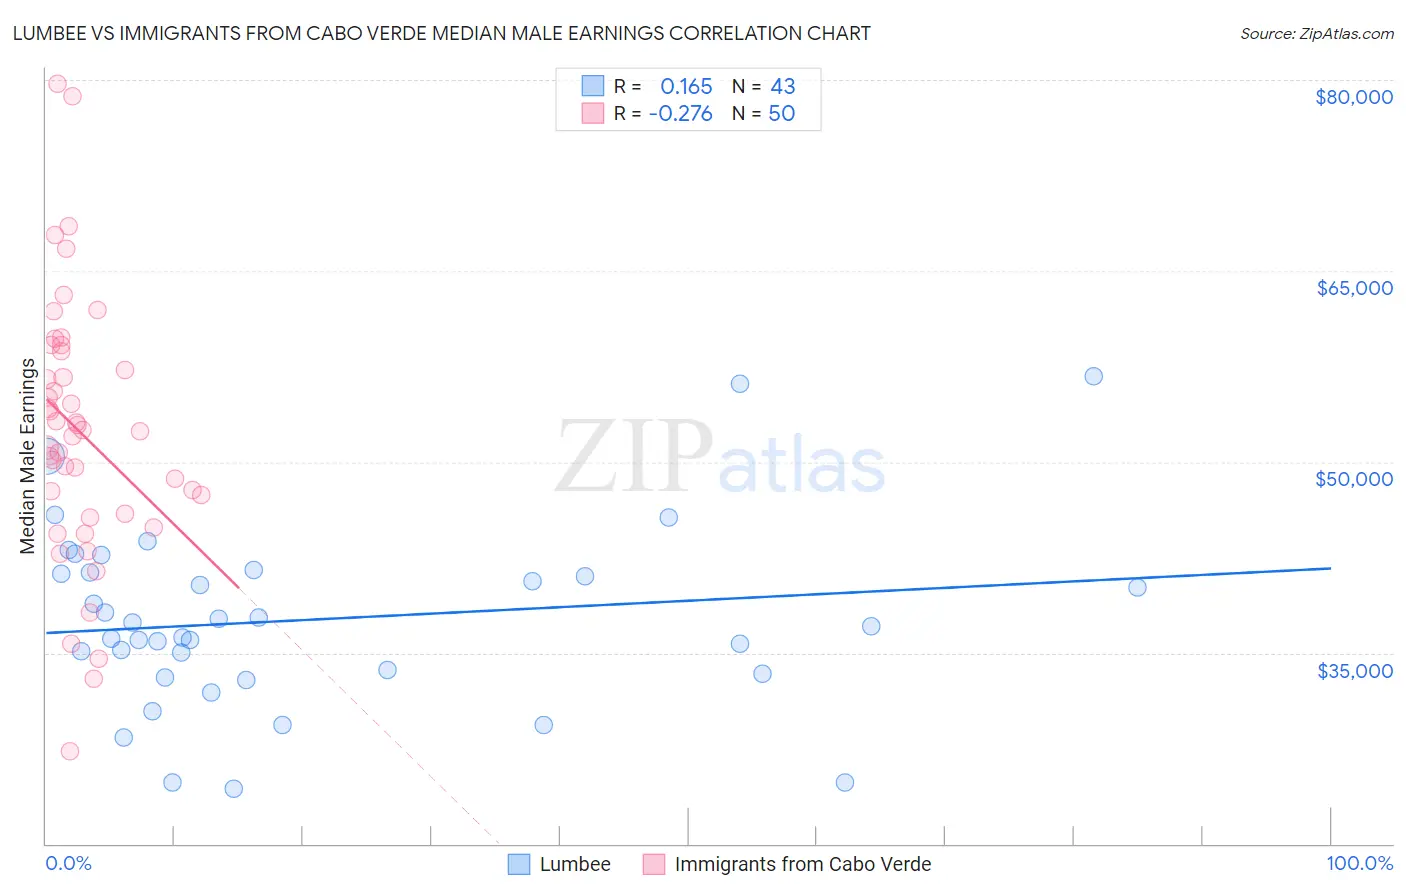
Lumbee vs Immigrants from Cabo Verde Median Male Earnings Correlation Chart
The statistical analysis conducted on geographies consisting of 92,276,202 people shows a poor positive correlation between the proportion of Lumbee and median male earnings in the United States with a correlation coefficient (R) of 0.165 and weighted average of $41,715. Similarly, the statistical analysis conducted on geographies consisting of 38,152,357 people shows a weak negative correlation between the proportion of Immigrants from Cabo Verde and median male earnings in the United States with a correlation coefficient (R) of -0.276 and weighted average of $50,009, a difference of 19.9%.
Median Male Earnings Correlation Summary
| Measurement | Lumbee | Immigrants from Cabo Verde |
| Minimum | $24,297 | $27,292 |
| Maximum | $56,719 | $79,684 |
| Range | $32,422 | $52,392 |
| Mean | $37,623 | $52,373 |
| Median | $37,072 | $52,422 |
| Interquartile 25% (IQ1) | $33,323 | $45,929 |
| Interquartile 75% (IQ3) | $41,323 | $58,666 |
| Interquartile Range (IQR) | $8,000 | $12,737 |
| Standard Deviation (Sample) | $7,117 | $10,362 |
| Standard Deviation (Population) | $7,034 | $10,258 |
Similar Demographics by Median Male Earnings
Demographics Similar to Lumbee by Median Male Earnings
In terms of median male earnings, the demographic groups most similar to Lumbee are Arapaho ($41,758, a difference of 0.10%), Hopi ($42,060, a difference of 0.83%), Navajo ($42,098, a difference of 0.92%), Pueblo ($41,314, a difference of 0.97%), and Pima ($42,357, a difference of 1.5%).
| Demographics | Rating | Rank | Median Male Earnings |
| Immigrants | Congo | 0.0 /100 | #333 | Tragic $44,204 |
| Immigrants | Yemen | 0.0 /100 | #334 | Tragic $44,083 |
| Spanish American Indians | 0.0 /100 | #335 | Tragic $44,010 |
| Immigrants | Cuba | 0.0 /100 | #336 | Tragic $43,461 |
| Menominee | 0.0 /100 | #337 | Tragic $42,581 |
| Crow | 0.0 /100 | #338 | Tragic $42,434 |
| Pima | 0.0 /100 | #339 | Tragic $42,357 |
| Navajo | 0.0 /100 | #340 | Tragic $42,098 |
| Hopi | 0.0 /100 | #341 | Tragic $42,060 |
| Arapaho | 0.0 /100 | #342 | Tragic $41,758 |
| Lumbee | 0.0 /100 | #343 | Tragic $41,715 |
| Pueblo | 0.0 /100 | #344 | Tragic $41,314 |
| Puerto Ricans | 0.0 /100 | #345 | Tragic $40,071 |
| Tohono O'odham | 0.0 /100 | #346 | Tragic $39,543 |
| Yup'ik | 0.0 /100 | #347 | Tragic $39,504 |
Demographics Similar to Immigrants from Cabo Verde by Median Male Earnings
In terms of median male earnings, the demographic groups most similar to Immigrants from Cabo Verde are German Russian ($49,924, a difference of 0.17%), Senegalese ($49,774, a difference of 0.47%), Alaskan Athabascan ($49,748, a difference of 0.52%), Immigrants from Grenada ($50,279, a difference of 0.54%), and Osage ($50,292, a difference of 0.57%).
| Demographics | Rating | Rank | Median Male Earnings |
| Hawaiians | 1.9 /100 | #245 | Tragic $50,488 |
| Immigrants | Ecuador | 1.9 /100 | #246 | Tragic $50,474 |
| Sub-Saharan Africans | 1.8 /100 | #247 | Tragic $50,408 |
| Immigrants | Guyana | 1.6 /100 | #248 | Tragic $50,321 |
| Immigrants | Burma/Myanmar | 1.6 /100 | #249 | Tragic $50,298 |
| Osage | 1.6 /100 | #250 | Tragic $50,292 |
| Immigrants | Grenada | 1.6 /100 | #251 | Tragic $50,279 |
| Immigrants | Cabo Verde | 1.2 /100 | #252 | Tragic $50,009 |
| German Russians | 1.1 /100 | #253 | Tragic $49,924 |
| Senegalese | 1.0 /100 | #254 | Tragic $49,774 |
| Alaskan Athabascans | 0.9 /100 | #255 | Tragic $49,748 |
| Alaska Natives | 0.9 /100 | #256 | Tragic $49,711 |
| British West Indians | 0.8 /100 | #257 | Tragic $49,636 |
| Cree | 0.7 /100 | #258 | Tragic $49,497 |
| Nepalese | 0.7 /100 | #259 | Tragic $49,458 |