U.S. Virgin Islander vs Immigrants from Vietnam Median Male Earnings
COMPARE
U.S. Virgin Islander
Immigrants from Vietnam
Median Male Earnings
Median Male Earnings Comparison
U.S. Virgin Islanders
Immigrants from Vietnam
$47,066
MEDIAN MALE EARNINGS
0.1/ 100
METRIC RATING
300th/ 347
METRIC RANK
$54,913
MEDIAN MALE EARNINGS
60.2/ 100
METRIC RATING
168th/ 347
METRIC RANK
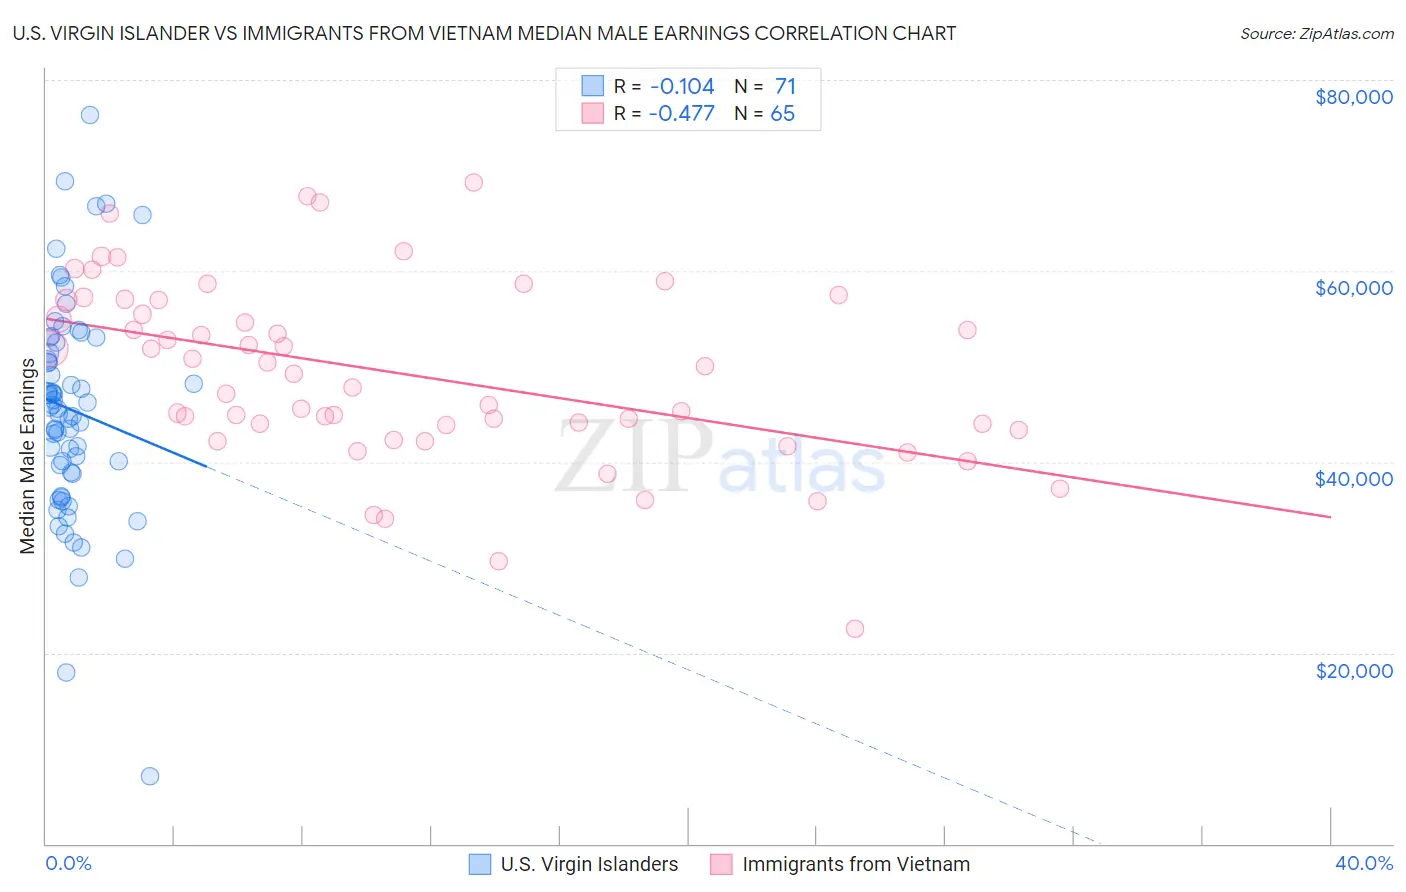
U.S. Virgin Islander vs Immigrants from Vietnam Median Male Earnings Correlation Chart
The statistical analysis conducted on geographies consisting of 87,522,677 people shows a poor negative correlation between the proportion of U.S. Virgin Islanders and median male earnings in the United States with a correlation coefficient (R) of -0.104 and weighted average of $47,066. Similarly, the statistical analysis conducted on geographies consisting of 404,603,118 people shows a moderate negative correlation between the proportion of Immigrants from Vietnam and median male earnings in the United States with a correlation coefficient (R) of -0.477 and weighted average of $54,913, a difference of 16.7%.
Median Male Earnings Correlation Summary
| Measurement | U.S. Virgin Islander | Immigrants from Vietnam |
| Minimum | $7,097 | $22,532 |
| Maximum | $76,348 | $69,274 |
| Range | $69,251 | $46,742 |
| Mean | $45,487 | $49,248 |
| Median | $45,658 | $49,189 |
| Interquartile 25% (IQ1) | $38,902 | $43,623 |
| Interquartile 75% (IQ3) | $52,442 | $56,949 |
| Interquartile Range (IQR) | $13,540 | $13,326 |
| Standard Deviation (Sample) | $11,420 | $9,503 |
| Standard Deviation (Population) | $11,340 | $9,429 |
Similar Demographics by Median Male Earnings
Demographics Similar to U.S. Virgin Islanders by Median Male Earnings
In terms of median male earnings, the demographic groups most similar to U.S. Virgin Islanders are Immigrants from Zaire ($47,070, a difference of 0.010%), Immigrants from Micronesia ($47,177, a difference of 0.23%), Immigrants from Latin America ($46,941, a difference of 0.27%), Dominican ($47,204, a difference of 0.29%), and Inupiat ($47,281, a difference of 0.46%).
| Demographics | Rating | Rank | Median Male Earnings |
| Indonesians | 0.1 /100 | #293 | Tragic $47,503 |
| Immigrants | Nicaragua | 0.1 /100 | #294 | Tragic $47,482 |
| Central American Indians | 0.1 /100 | #295 | Tragic $47,433 |
| Inupiat | 0.1 /100 | #296 | Tragic $47,281 |
| Dominicans | 0.1 /100 | #297 | Tragic $47,204 |
| Immigrants | Micronesia | 0.1 /100 | #298 | Tragic $47,177 |
| Immigrants | Zaire | 0.1 /100 | #299 | Tragic $47,070 |
| U.S. Virgin Islanders | 0.1 /100 | #300 | Tragic $47,066 |
| Immigrants | Latin America | 0.1 /100 | #301 | Tragic $46,941 |
| Seminole | 0.1 /100 | #302 | Tragic $46,783 |
| Yaqui | 0.1 /100 | #303 | Tragic $46,777 |
| Bangladeshis | 0.1 /100 | #304 | Tragic $46,744 |
| Guatemalans | 0.0 /100 | #305 | Tragic $46,736 |
| Dutch West Indians | 0.0 /100 | #306 | Tragic $46,656 |
| Immigrants | Dominican Republic | 0.0 /100 | #307 | Tragic $46,655 |
Demographics Similar to Immigrants from Vietnam by Median Male Earnings
In terms of median male earnings, the demographic groups most similar to Immigrants from Vietnam are Immigrants from Fiji ($54,958, a difference of 0.080%), German ($54,974, a difference of 0.11%), French Canadian ($54,722, a difference of 0.35%), Finnish ($54,721, a difference of 0.35%), and Immigrants from Peru ($54,695, a difference of 0.40%).
| Demographics | Rating | Rank | Median Male Earnings |
| Belgians | 70.1 /100 | #161 | Good $55,361 |
| French | 69.9 /100 | #162 | Good $55,350 |
| Ugandans | 68.6 /100 | #163 | Good $55,290 |
| Immigrants | South Eastern Asia | 67.6 /100 | #164 | Good $55,241 |
| Immigrants | Portugal | 66.3 /100 | #165 | Good $55,182 |
| Germans | 61.6 /100 | #166 | Good $54,974 |
| Immigrants | Fiji | 61.2 /100 | #167 | Good $54,958 |
| Immigrants | Vietnam | 60.2 /100 | #168 | Good $54,913 |
| French Canadians | 55.6 /100 | #169 | Average $54,722 |
| Finns | 55.6 /100 | #170 | Average $54,721 |
| Immigrants | Peru | 54.9 /100 | #171 | Average $54,695 |
| Welsh | 53.8 /100 | #172 | Average $54,647 |
| South American Indians | 50.4 /100 | #173 | Average $54,508 |
| South Americans | 50.0 /100 | #174 | Average $54,492 |
| Dutch | 48.0 /100 | #175 | Average $54,410 |