South American vs Immigrants from Switzerland Median Household Income
COMPARE
South American
Immigrants from Switzerland
Median Household Income
Median Household Income Comparison
South Americans
Immigrants from Switzerland
$86,824
MEDIAN HOUSEHOLD INCOME
75.1/ 100
METRIC RATING
153rd/ 347
METRIC RANK
$97,979
MEDIAN HOUSEHOLD INCOME
100.0/ 100
METRIC RATING
35th/ 347
METRIC RANK
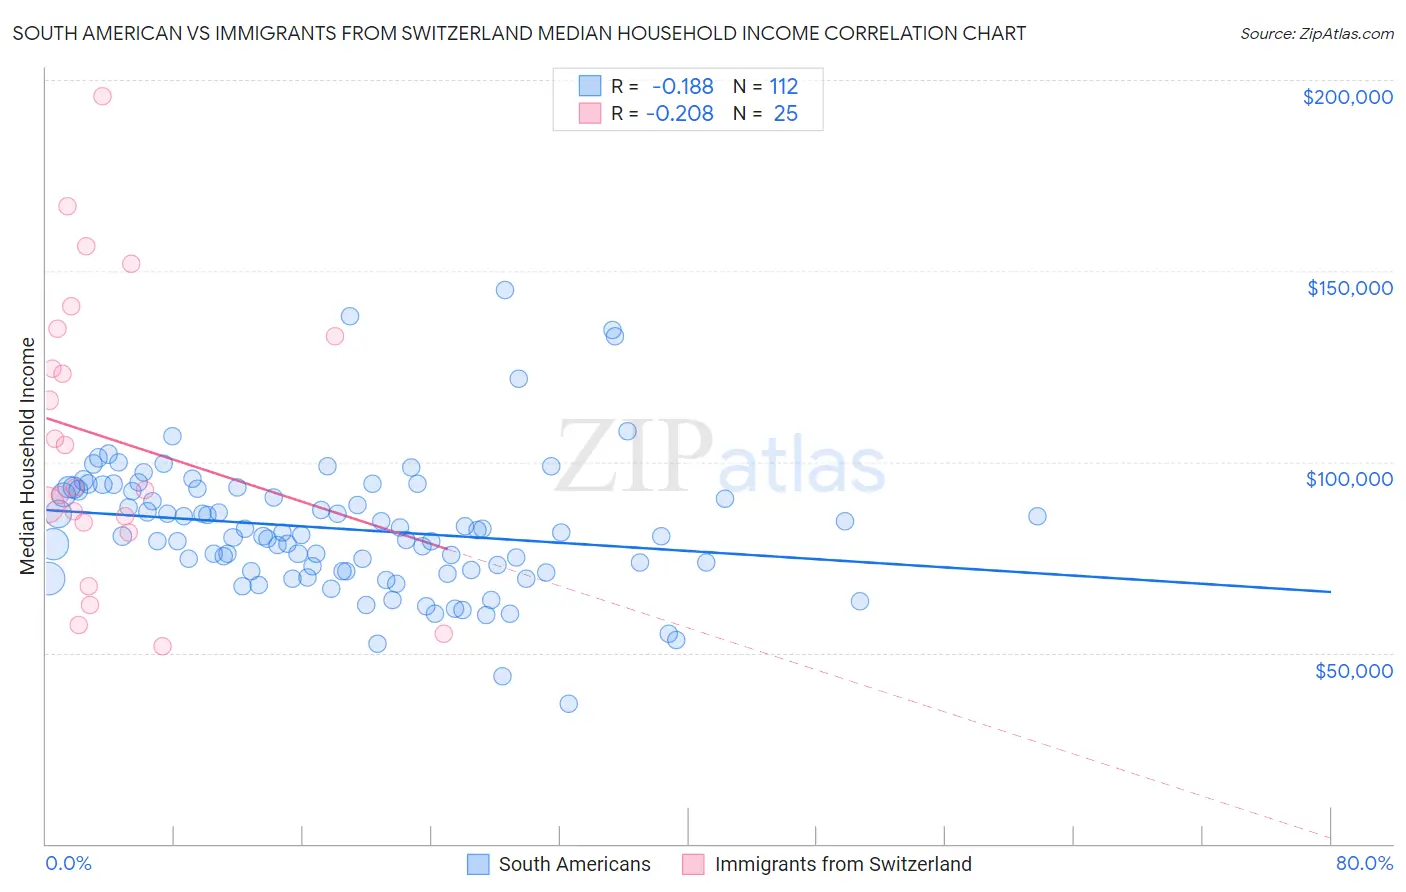
South American vs Immigrants from Switzerland Median Household Income Correlation Chart
The statistical analysis conducted on geographies consisting of 493,431,068 people shows a poor negative correlation between the proportion of South Americans and median household income in the United States with a correlation coefficient (R) of -0.188 and weighted average of $86,824. Similarly, the statistical analysis conducted on geographies consisting of 148,056,974 people shows a weak negative correlation between the proportion of Immigrants from Switzerland and median household income in the United States with a correlation coefficient (R) of -0.208 and weighted average of $97,979, a difference of 12.9%.
Median Household Income Correlation Summary
| Measurement | South American | Immigrants from Switzerland |
| Minimum | $36,563 | $51,573 |
| Maximum | $145,121 | $195,586 |
| Range | $108,558 | $144,013 |
| Mean | $82,451 | $106,072 |
| Median | $80,811 | $93,190 |
| Interquartile 25% (IQ1) | $71,448 | $82,852 |
| Interquartile 75% (IQ3) | $92,775 | $133,796 |
| Interquartile Range (IQR) | $21,327 | $50,943 |
| Standard Deviation (Sample) | $17,445 | $37,589 |
| Standard Deviation (Population) | $17,367 | $36,829 |
Similar Demographics by Median Household Income
Demographics Similar to South Americans by Median Household Income
In terms of median household income, the demographic groups most similar to South Americans are Immigrants from Saudi Arabia ($86,875, a difference of 0.060%), Immigrants from Germany ($86,764, a difference of 0.070%), Hungarian ($86,920, a difference of 0.11%), Basque ($87,001, a difference of 0.20%), and Carpatho Rusyn ($86,635, a difference of 0.22%).
| Demographics | Rating | Rank | Median Household Income |
| Immigrants | Uganda | 82.8 /100 | #146 | Excellent $87,553 |
| South American Indians | 81.8 /100 | #147 | Excellent $87,446 |
| Costa Ricans | 80.0 /100 | #148 | Excellent $87,262 |
| Immigrants | Nepal | 77.7 /100 | #149 | Good $87,046 |
| Basques | 77.2 /100 | #150 | Good $87,001 |
| Hungarians | 76.3 /100 | #151 | Good $86,920 |
| Immigrants | Saudi Arabia | 75.8 /100 | #152 | Good $86,875 |
| South Americans | 75.1 /100 | #153 | Good $86,824 |
| Immigrants | Germany | 74.4 /100 | #154 | Good $86,764 |
| Carpatho Rusyns | 72.8 /100 | #155 | Good $86,635 |
| Immigrants | Albania | 71.5 /100 | #156 | Good $86,534 |
| Samoans | 71.0 /100 | #157 | Good $86,498 |
| Moroccans | 70.6 /100 | #158 | Good $86,468 |
| Immigrants | Uzbekistan | 70.1 /100 | #159 | Good $86,425 |
| Luxembourgers | 70.0 /100 | #160 | Good $86,418 |
Demographics Similar to Immigrants from Switzerland by Median Household Income
In terms of median household income, the demographic groups most similar to Immigrants from Switzerland are Russian ($98,008, a difference of 0.030%), Immigrants from Pakistan ($97,528, a difference of 0.46%), Chinese ($98,496, a difference of 0.53%), Immigrants from Denmark ($98,510, a difference of 0.54%), and Latvian ($97,311, a difference of 0.69%).
| Demographics | Rating | Rank | Median Household Income |
| Immigrants | Sri Lanka | 100.0 /100 | #28 | Exceptional $99,943 |
| Immigrants | Asia | 100.0 /100 | #29 | Exceptional $99,933 |
| Immigrants | Northern Europe | 100.0 /100 | #30 | Exceptional $99,813 |
| Turks | 100.0 /100 | #31 | Exceptional $99,389 |
| Immigrants | Denmark | 100.0 /100 | #32 | Exceptional $98,510 |
| Chinese | 100.0 /100 | #33 | Exceptional $98,496 |
| Russians | 100.0 /100 | #34 | Exceptional $98,008 |
| Immigrants | Switzerland | 100.0 /100 | #35 | Exceptional $97,979 |
| Immigrants | Pakistan | 100.0 /100 | #36 | Exceptional $97,528 |
| Latvians | 100.0 /100 | #37 | Exceptional $97,311 |
| Immigrants | Indonesia | 100.0 /100 | #38 | Exceptional $97,297 |
| Afghans | 100.0 /100 | #39 | Exceptional $97,026 |
| Maltese | 100.0 /100 | #40 | Exceptional $97,015 |
| Immigrants | Turkey | 100.0 /100 | #41 | Exceptional $96,964 |
| Immigrants | Lithuania | 99.9 /100 | #42 | Exceptional $96,836 |