Lumbee vs Immigrants from Switzerland 8th Grade
COMPARE
Lumbee
Immigrants from Switzerland
8th Grade
8th Grade Comparison
Lumbee
Immigrants from Switzerland
96.0%
8TH GRADE
84.1/ 100
METRIC RATING
145th/ 347
METRIC RANK
96.2%
8TH GRADE
95.3/ 100
METRIC RATING
119th/ 347
METRIC RANK
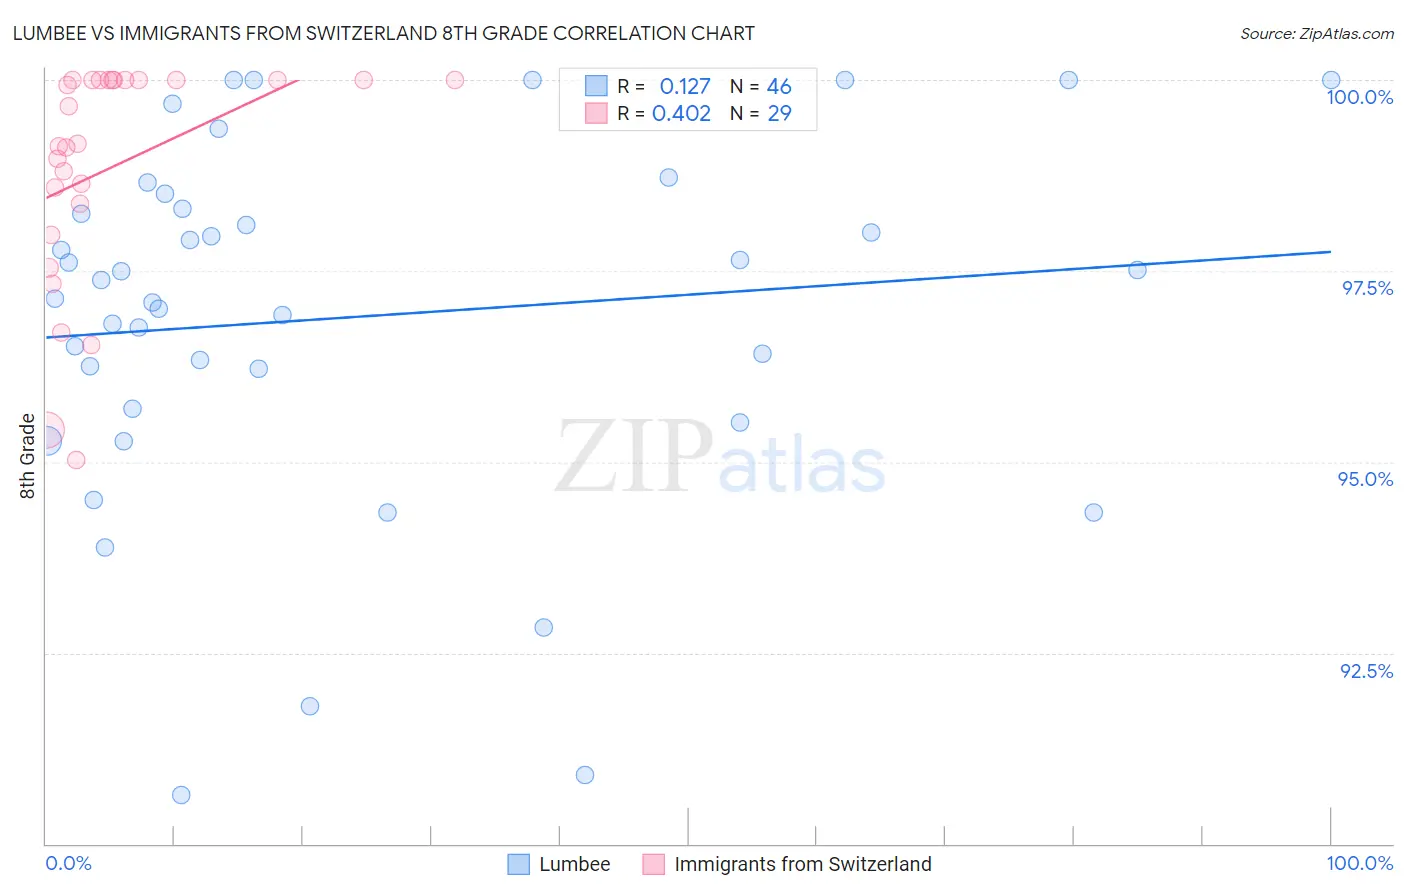
Lumbee vs Immigrants from Switzerland 8th Grade Correlation Chart
The statistical analysis conducted on geographies consisting of 92,298,865 people shows a poor positive correlation between the proportion of Lumbee and percentage of population with at least 8th grade education in the United States with a correlation coefficient (R) of 0.127 and weighted average of 96.0%. Similarly, the statistical analysis conducted on geographies consisting of 148,082,451 people shows a moderate positive correlation between the proportion of Immigrants from Switzerland and percentage of population with at least 8th grade education in the United States with a correlation coefficient (R) of 0.402 and weighted average of 96.2%, a difference of 0.22%.
8th Grade Correlation Summary
| Measurement | Lumbee | Immigrants from Switzerland |
| Minimum | 90.6% | 95.0% |
| Maximum | 100.0% | 100.0% |
| Range | 9.4% | 5.0% |
| Mean | 96.9% | 98.9% |
| Median | 97.3% | 99.2% |
| Interquartile 25% (IQ1) | 95.7% | 98.2% |
| Interquartile 75% (IQ3) | 98.3% | 100.0% |
| Interquartile Range (IQR) | 2.6% | 1.8% |
| Standard Deviation (Sample) | 2.3% | 1.5% |
| Standard Deviation (Population) | 2.3% | 1.4% |
Similar Demographics by 8th Grade
Demographics Similar to Lumbee by 8th Grade
In terms of 8th grade, the demographic groups most similar to Lumbee are Israeli (96.0%, a difference of 0.0%), Colville (96.0%, a difference of 0.0%), Spanish (96.0%, a difference of 0.010%), Immigrants from Belarus (96.0%, a difference of 0.010%), and Albanian (96.0%, a difference of 0.010%).
| Demographics | Rating | Rank | 8th Grade |
| Burmese | 90.2 /100 | #138 | Exceptional 96.1% |
| Hmong | 89.7 /100 | #139 | Excellent 96.1% |
| Immigrants | South Central Asia | 89.4 /100 | #140 | Excellent 96.1% |
| Immigrants | Greece | 85.9 /100 | #141 | Excellent 96.0% |
| Immigrants | Eastern Europe | 85.4 /100 | #142 | Excellent 96.0% |
| Spanish | 85.1 /100 | #143 | Excellent 96.0% |
| Immigrants | Belarus | 84.8 /100 | #144 | Excellent 96.0% |
| Lumbee | 84.1 /100 | #145 | Excellent 96.0% |
| Israelis | 84.1 /100 | #146 | Excellent 96.0% |
| Colville | 84.0 /100 | #147 | Excellent 96.0% |
| Albanians | 83.1 /100 | #148 | Excellent 96.0% |
| Immigrants | Israel | 81.3 /100 | #149 | Excellent 96.0% |
| Immigrants | Russia | 80.9 /100 | #150 | Excellent 96.0% |
| Blackfeet | 80.8 /100 | #151 | Excellent 96.0% |
| French American Indians | 80.6 /100 | #152 | Excellent 96.0% |
Demographics Similar to Immigrants from Switzerland by 8th Grade
In terms of 8th grade, the demographic groups most similar to Immigrants from Switzerland are Immigrants from France (96.2%, a difference of 0.0%), Immigrants from Bulgaria (96.2%, a difference of 0.0%), Immigrants from Europe (96.2%, a difference of 0.0%), Immigrants from Norway (96.2%, a difference of 0.020%), and Filipino (96.2%, a difference of 0.020%).
| Demographics | Rating | Rank | 8th Grade |
| Syrians | 96.7 /100 | #112 | Exceptional 96.3% |
| Immigrants | Zimbabwe | 96.7 /100 | #113 | Exceptional 96.3% |
| Immigrants | Japan | 96.5 /100 | #114 | Exceptional 96.2% |
| Immigrants | Moldova | 96.5 /100 | #115 | Exceptional 96.2% |
| Immigrants | Nonimmigrants | 96.0 /100 | #116 | Exceptional 96.2% |
| Immigrants | Croatia | 96.0 /100 | #117 | Exceptional 96.2% |
| Immigrants | Norway | 95.7 /100 | #118 | Exceptional 96.2% |
| Immigrants | Switzerland | 95.3 /100 | #119 | Exceptional 96.2% |
| Immigrants | France | 95.3 /100 | #120 | Exceptional 96.2% |
| Immigrants | Bulgaria | 95.3 /100 | #121 | Exceptional 96.2% |
| Immigrants | Europe | 95.3 /100 | #122 | Exceptional 96.2% |
| Filipinos | 94.6 /100 | #123 | Exceptional 96.2% |
| Palestinians | 94.6 /100 | #124 | Exceptional 96.2% |
| Immigrants | Romania | 94.1 /100 | #125 | Exceptional 96.2% |
| Choctaw | 94.0 /100 | #126 | Exceptional 96.2% |