Immigrants from Uruguay vs Immigrants from Senegal Median Male Earnings
COMPARE
Immigrants from Uruguay
Immigrants from Senegal
Median Male Earnings
Median Male Earnings Comparison
Immigrants from Uruguay
Immigrants from Senegal
$52,860
MEDIAN MALE EARNINGS
16.8/ 100
METRIC RATING
202nd/ 347
METRIC RANK
$51,647
MEDIAN MALE EARNINGS
5.8/ 100
METRIC RATING
221st/ 347
METRIC RANK
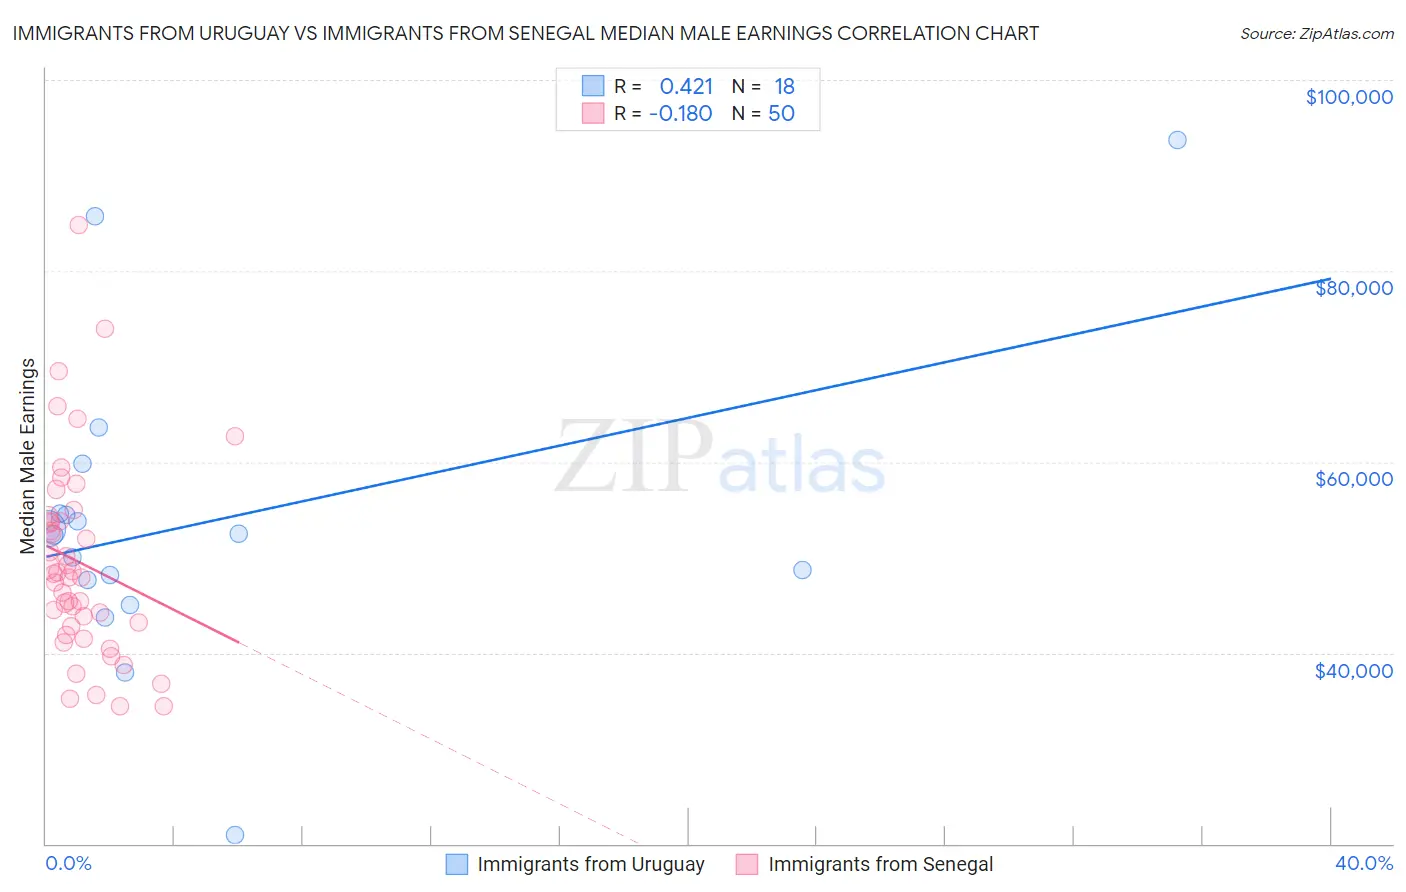
Immigrants from Uruguay vs Immigrants from Senegal Median Male Earnings Correlation Chart
The statistical analysis conducted on geographies consisting of 133,249,563 people shows a moderate positive correlation between the proportion of Immigrants from Uruguay and median male earnings in the United States with a correlation coefficient (R) of 0.421 and weighted average of $52,860. Similarly, the statistical analysis conducted on geographies consisting of 90,120,313 people shows a poor negative correlation between the proportion of Immigrants from Senegal and median male earnings in the United States with a correlation coefficient (R) of -0.180 and weighted average of $51,647, a difference of 2.4%.
Median Male Earnings Correlation Summary
| Measurement | Immigrants from Uruguay | Immigrants from Senegal |
| Minimum | $20,946 | $34,387 |
| Maximum | $93,710 | $84,866 |
| Range | $72,764 | $50,479 |
| Mean | $53,632 | $49,446 |
| Median | $52,453 | $48,099 |
| Interquartile 25% (IQ1) | $47,598 | $42,790 |
| Interquartile 75% (IQ3) | $54,536 | $53,838 |
| Interquartile Range (IQR) | $6,938 | $11,049 |
| Standard Deviation (Sample) | $16,044 | $10,360 |
| Standard Deviation (Population) | $15,592 | $10,256 |
Demographics Similar to Immigrants from Uruguay and Immigrants from Senegal by Median Male Earnings
In terms of median male earnings, the demographic groups most similar to Immigrants from Uruguay are Immigrants from Bosnia and Herzegovina ($52,869, a difference of 0.020%), Panamanian ($52,835, a difference of 0.050%), Ghanaian ($52,810, a difference of 0.10%), Immigrants from Colombia ($52,725, a difference of 0.26%), and Immigrants from Iraq ($52,681, a difference of 0.34%). Similarly, the demographic groups most similar to Immigrants from Senegal are Immigrants from Armenia ($51,793, a difference of 0.28%), Immigrants from Ghana ($51,836, a difference of 0.37%), Immigrants from Panama ($51,962, a difference of 0.61%), Immigrants from Venezuela ($52,041, a difference of 0.76%), and Nigerian ($52,039, a difference of 0.76%).
| Demographics | Rating | Rank | Median Male Earnings |
| Immigrants | Bosnia and Herzegovina | 16.9 /100 | #201 | Poor $52,869 |
| Immigrants | Uruguay | 16.8 /100 | #202 | Poor $52,860 |
| Panamanians | 16.5 /100 | #203 | Poor $52,835 |
| Ghanaians | 16.1 /100 | #204 | Poor $52,810 |
| Immigrants | Colombia | 15.0 /100 | #205 | Poor $52,725 |
| Immigrants | Iraq | 14.5 /100 | #206 | Poor $52,681 |
| Vietnamese | 12.7 /100 | #207 | Poor $52,525 |
| Venezuelans | 12.5 /100 | #208 | Poor $52,510 |
| Bermudans | 12.1 /100 | #209 | Poor $52,465 |
| Delaware | 11.5 /100 | #210 | Poor $52,412 |
| Tlingit-Haida | 11.5 /100 | #211 | Poor $52,409 |
| Cajuns | 10.7 /100 | #212 | Poor $52,325 |
| Native Hawaiians | 10.5 /100 | #213 | Poor $52,306 |
| Immigrants | Nonimmigrants | 9.3 /100 | #214 | Tragic $52,170 |
| Immigrants | Cameroon | 8.9 /100 | #215 | Tragic $52,119 |
| Immigrants | Venezuela | 8.3 /100 | #216 | Tragic $52,041 |
| Nigerians | 8.3 /100 | #217 | Tragic $52,039 |
| Immigrants | Panama | 7.7 /100 | #218 | Tragic $51,962 |
| Immigrants | Ghana | 6.9 /100 | #219 | Tragic $51,836 |
| Immigrants | Armenia | 6.6 /100 | #220 | Tragic $51,793 |
| Immigrants | Senegal | 5.8 /100 | #221 | Tragic $51,647 |