Lumbee vs Immigrants from Pakistan In Labor Force | Age 45-54
COMPARE
Lumbee
Immigrants from Pakistan
In Labor Force | Age 45-54
In Labor Force | Age 45-54 Comparison
Lumbee
Immigrants from Pakistan
75.6%
IN LABOR FORCE | AGE 45-54
0.0/ 100
METRIC RATING
340th/ 347
METRIC RANK
83.8%
IN LABOR FORCE | AGE 45-54
99.7/ 100
METRIC RATING
29th/ 347
METRIC RANK
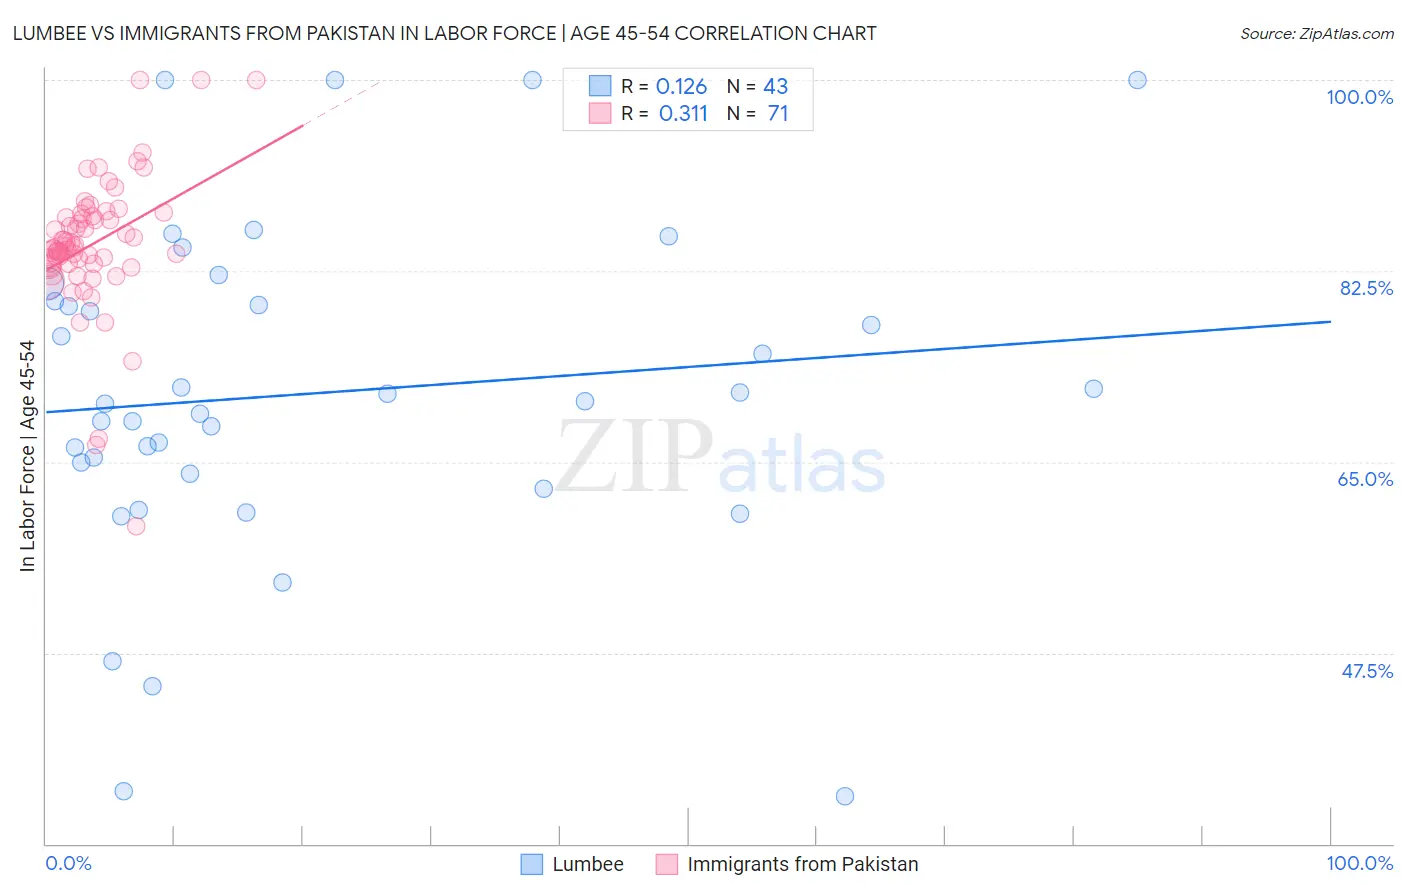
Lumbee vs Immigrants from Pakistan In Labor Force | Age 45-54 Correlation Chart
The statistical analysis conducted on geographies consisting of 92,258,023 people shows a poor positive correlation between the proportion of Lumbee and labor force participation rate among population between the ages 45 and 54 in the United States with a correlation coefficient (R) of 0.126 and weighted average of 75.6%. Similarly, the statistical analysis conducted on geographies consisting of 283,776,614 people shows a mild positive correlation between the proportion of Immigrants from Pakistan and labor force participation rate among population between the ages 45 and 54 in the United States with a correlation coefficient (R) of 0.311 and weighted average of 83.8%, a difference of 10.9%.
In Labor Force | Age 45-54 Correlation Summary
| Measurement | Lumbee | Immigrants from Pakistan |
| Minimum | 34.3% | 59.1% |
| Maximum | 100.0% | 100.0% |
| Range | 65.7% | 40.9% |
| Mean | 71.3% | 84.9% |
| Median | 70.6% | 84.7% |
| Interquartile 25% (IQ1) | 63.9% | 83.2% |
| Interquartile 75% (IQ3) | 79.7% | 87.5% |
| Interquartile Range (IQR) | 15.8% | 4.3% |
| Standard Deviation (Sample) | 15.3% | 6.3% |
| Standard Deviation (Population) | 15.1% | 6.3% |
Similar Demographics by In Labor Force | Age 45-54
Demographics Similar to Lumbee by In Labor Force | Age 45-54
In terms of in labor force | age 45-54, the demographic groups most similar to Lumbee are Pueblo (75.5%, a difference of 0.12%), Puerto Rican (75.9%, a difference of 0.46%), Tohono O'odham (75.1%, a difference of 0.61%), Hopi (75.0%, a difference of 0.79%), and Yuman (76.3%, a difference of 0.95%).
| Demographics | Rating | Rank | In Labor Force | Age 45-54 |
| Natives/Alaskans | 0.0 /100 | #333 | Tragic 77.1% |
| Apache | 0.0 /100 | #334 | Tragic 77.1% |
| Arapaho | 0.0 /100 | #335 | Tragic 77.1% |
| Paiute | 0.0 /100 | #336 | Tragic 76.7% |
| Ute | 0.0 /100 | #337 | Tragic 76.6% |
| Yuman | 0.0 /100 | #338 | Tragic 76.3% |
| Puerto Ricans | 0.0 /100 | #339 | Tragic 75.9% |
| Lumbee | 0.0 /100 | #340 | Tragic 75.6% |
| Pueblo | 0.0 /100 | #341 | Tragic 75.5% |
| Tohono O'odham | 0.0 /100 | #342 | Tragic 75.1% |
| Hopi | 0.0 /100 | #343 | Tragic 75.0% |
| Immigrants | Yemen | 0.0 /100 | #344 | Tragic 74.4% |
| Houma | 0.0 /100 | #345 | Tragic 74.1% |
| Pima | 0.0 /100 | #346 | Tragic 72.8% |
| Navajo | 0.0 /100 | #347 | Tragic 72.8% |
Demographics Similar to Immigrants from Pakistan by In Labor Force | Age 45-54
In terms of in labor force | age 45-54, the demographic groups most similar to Immigrants from Pakistan are Immigrants from Lithuania (83.9%, a difference of 0.020%), Immigrants from Brazil (83.9%, a difference of 0.030%), Immigrants from Bulgaria (83.8%, a difference of 0.030%), Immigrants from Serbia (83.9%, a difference of 0.040%), and Immigrants from North Macedonia (83.9%, a difference of 0.050%).
| Demographics | Rating | Rank | In Labor Force | Age 45-54 |
| Immigrants | Ireland | 99.8 /100 | #22 | Exceptional 83.9% |
| Tlingit-Haida | 99.8 /100 | #23 | Exceptional 83.9% |
| Slovenes | 99.8 /100 | #24 | Exceptional 83.9% |
| Immigrants | North Macedonia | 99.8 /100 | #25 | Exceptional 83.9% |
| Immigrants | Serbia | 99.8 /100 | #26 | Exceptional 83.9% |
| Immigrants | Brazil | 99.8 /100 | #27 | Exceptional 83.9% |
| Immigrants | Lithuania | 99.8 /100 | #28 | Exceptional 83.9% |
| Immigrants | Pakistan | 99.7 /100 | #29 | Exceptional 83.8% |
| Immigrants | Bulgaria | 99.7 /100 | #30 | Exceptional 83.8% |
| Immigrants | Eritrea | 99.7 /100 | #31 | Exceptional 83.8% |
| Turks | 99.7 /100 | #32 | Exceptional 83.8% |
| Latvians | 99.7 /100 | #33 | Exceptional 83.8% |
| Kenyans | 99.5 /100 | #34 | Exceptional 83.7% |
| Brazilians | 99.5 /100 | #35 | Exceptional 83.7% |
| Ugandans | 99.5 /100 | #36 | Exceptional 83.7% |