Lumbee vs Cajun Median Earnings
COMPARE
Lumbee
Cajun
Median Earnings
Median Earnings Comparison
Lumbee
Cajuns
$36,876
MEDIAN EARNINGS
0.0/ 100
METRIC RATING
341st/ 347
METRIC RANK
$42,189
MEDIAN EARNINGS
0.3/ 100
METRIC RATING
278th/ 347
METRIC RANK
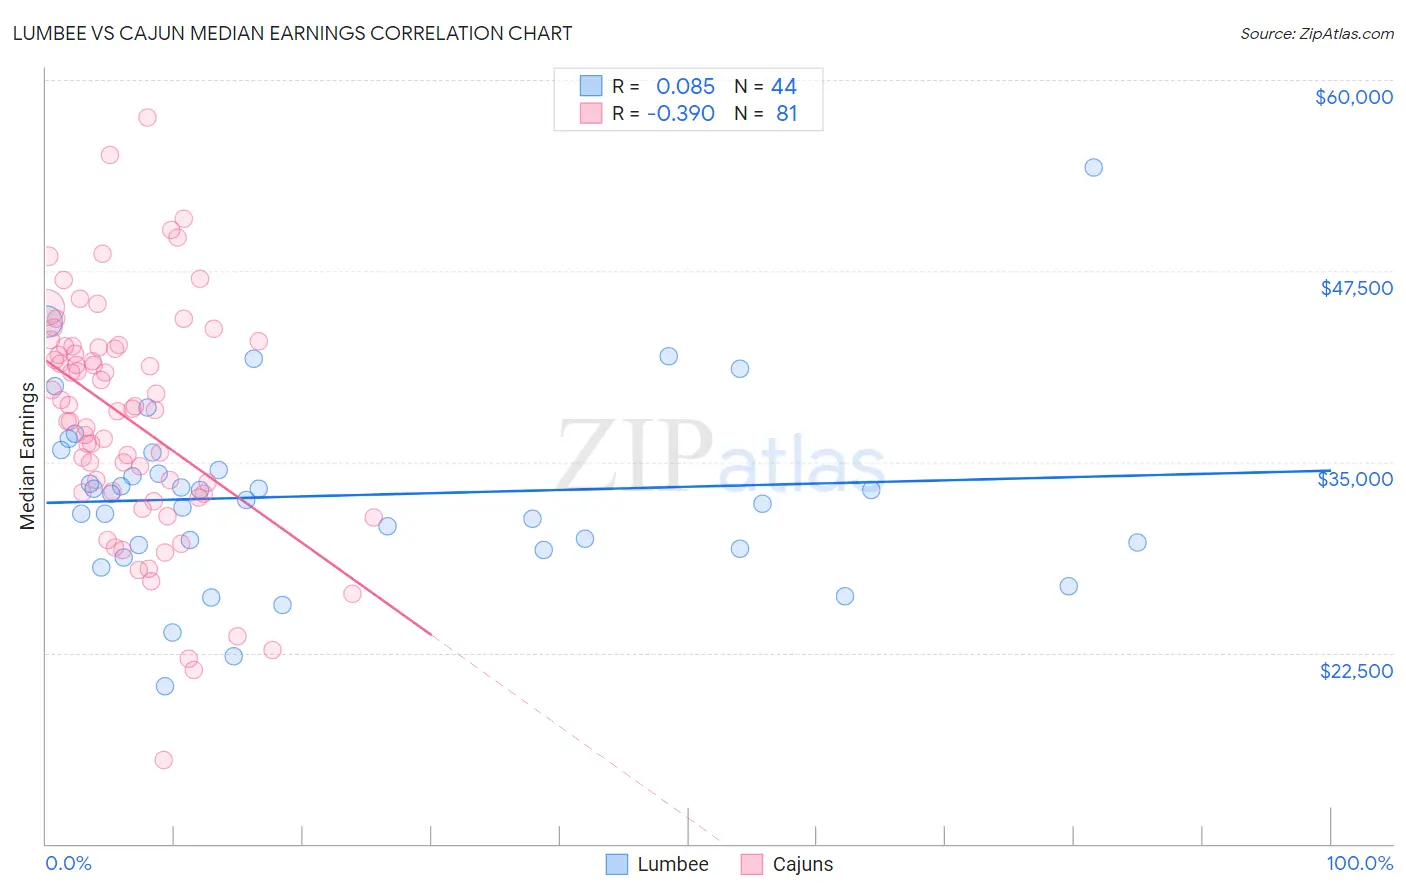
Lumbee vs Cajun Median Earnings Correlation Chart
The statistical analysis conducted on geographies consisting of 92,282,036 people shows a slight positive correlation between the proportion of Lumbee and median earnings in the United States with a correlation coefficient (R) of 0.085 and weighted average of $36,876. Similarly, the statistical analysis conducted on geographies consisting of 149,692,940 people shows a mild negative correlation between the proportion of Cajuns and median earnings in the United States with a correlation coefficient (R) of -0.390 and weighted average of $42,189, a difference of 14.4%.
Median Earnings Correlation Summary
| Measurement | Lumbee | Cajun |
| Minimum | $20,337 | $15,451 |
| Maximum | $54,265 | $57,514 |
| Range | $33,928 | $42,063 |
| Mean | $32,791 | $37,817 |
| Median | $32,724 | $38,499 |
| Interquartile 25% (IQ1) | $29,449 | $32,952 |
| Interquartile 75% (IQ3) | $35,034 | $42,585 |
| Interquartile Range (IQR) | $5,585 | $9,633 |
| Standard Deviation (Sample) | $6,085 | $7,734 |
| Standard Deviation (Population) | $6,015 | $7,686 |
Similar Demographics by Median Earnings
Demographics Similar to Lumbee by Median Earnings
In terms of median earnings, the demographic groups most similar to Lumbee are Hopi ($36,871, a difference of 0.010%), Pueblo ($36,859, a difference of 0.050%), Navajo ($36,999, a difference of 0.33%), Arapaho ($36,586, a difference of 0.79%), and Tohono O'odham ($36,349, a difference of 1.5%).
| Demographics | Rating | Rank | Median Earnings |
| Houma | 0.0 /100 | #333 | Tragic $38,949 |
| Spanish American Indians | 0.0 /100 | #334 | Tragic $38,907 |
| Natives/Alaskans | 0.0 /100 | #335 | Tragic $38,896 |
| Crow | 0.0 /100 | #336 | Tragic $38,707 |
| Immigrants | Cuba | 0.0 /100 | #337 | Tragic $38,426 |
| Pima | 0.0 /100 | #338 | Tragic $38,285 |
| Menominee | 0.0 /100 | #339 | Tragic $37,884 |
| Navajo | 0.0 /100 | #340 | Tragic $36,999 |
| Lumbee | 0.0 /100 | #341 | Tragic $36,876 |
| Hopi | 0.0 /100 | #342 | Tragic $36,871 |
| Pueblo | 0.0 /100 | #343 | Tragic $36,859 |
| Arapaho | 0.0 /100 | #344 | Tragic $36,586 |
| Tohono O'odham | 0.0 /100 | #345 | Tragic $36,349 |
| Yup'ik | 0.0 /100 | #346 | Tragic $35,942 |
| Puerto Ricans | 0.0 /100 | #347 | Tragic $35,560 |
Demographics Similar to Cajuns by Median Earnings
In terms of median earnings, the demographic groups most similar to Cajuns are Colville ($42,151, a difference of 0.090%), Hmong ($42,111, a difference of 0.19%), Central American ($42,280, a difference of 0.21%), Spanish American ($42,316, a difference of 0.30%), and Immigrants from Belize ($42,339, a difference of 0.36%).
| Demographics | Rating | Rank | Median Earnings |
| Pennsylvania Germans | 0.5 /100 | #271 | Tragic $42,615 |
| Iroquois | 0.4 /100 | #272 | Tragic $42,430 |
| Immigrants | Dominica | 0.4 /100 | #273 | Tragic $42,420 |
| Immigrants | El Salvador | 0.4 /100 | #274 | Tragic $42,413 |
| Immigrants | Belize | 0.3 /100 | #275 | Tragic $42,339 |
| Spanish Americans | 0.3 /100 | #276 | Tragic $42,316 |
| Central Americans | 0.3 /100 | #277 | Tragic $42,280 |
| Cajuns | 0.3 /100 | #278 | Tragic $42,189 |
| Colville | 0.2 /100 | #279 | Tragic $42,151 |
| Hmong | 0.2 /100 | #280 | Tragic $42,111 |
| Marshallese | 0.2 /100 | #281 | Tragic $41,969 |
| Africans | 0.2 /100 | #282 | Tragic $41,955 |
| Dominicans | 0.2 /100 | #283 | Tragic $41,864 |
| Blackfeet | 0.2 /100 | #284 | Tragic $41,822 |
| Immigrants | Nicaragua | 0.1 /100 | #285 | Tragic $41,737 |