Lumbee vs Lebanese Median Earnings
COMPARE
Lumbee
Lebanese
Median Earnings
Median Earnings Comparison
Lumbee
Lebanese
$36,876
MEDIAN EARNINGS
0.0/ 100
METRIC RATING
341st/ 347
METRIC RANK
$48,226
MEDIAN EARNINGS
92.5/ 100
METRIC RATING
131st/ 347
METRIC RANK
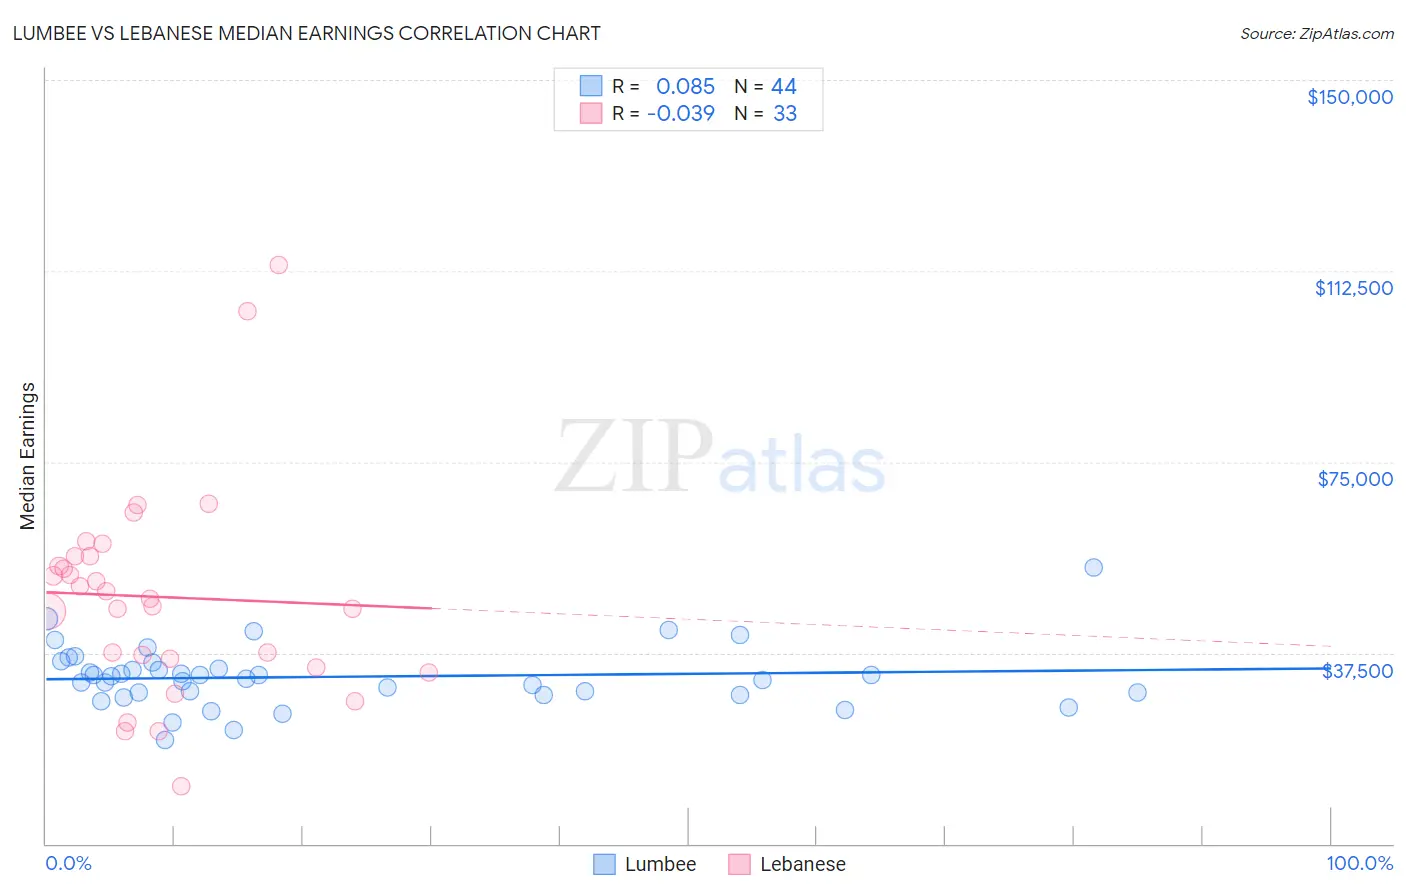
Lumbee vs Lebanese Median Earnings Correlation Chart
The statistical analysis conducted on geographies consisting of 92,282,036 people shows a slight positive correlation between the proportion of Lumbee and median earnings in the United States with a correlation coefficient (R) of 0.085 and weighted average of $36,876. Similarly, the statistical analysis conducted on geographies consisting of 401,606,109 people shows no correlation between the proportion of Lebanese and median earnings in the United States with a correlation coefficient (R) of -0.039 and weighted average of $48,226, a difference of 30.8%.
Median Earnings Correlation Summary
| Measurement | Lumbee | Lebanese |
| Minimum | $20,337 | $11,384 |
| Maximum | $54,265 | $113,646 |
| Range | $33,928 | $102,262 |
| Mean | $32,791 | $48,478 |
| Median | $32,724 | $48,125 |
| Interquartile 25% (IQ1) | $29,449 | $35,416 |
| Interquartile 75% (IQ3) | $35,034 | $56,506 |
| Interquartile Range (IQR) | $5,585 | $21,090 |
| Standard Deviation (Sample) | $6,085 | $20,869 |
| Standard Deviation (Population) | $6,015 | $20,550 |
Similar Demographics by Median Earnings
Demographics Similar to Lumbee by Median Earnings
In terms of median earnings, the demographic groups most similar to Lumbee are Hopi ($36,871, a difference of 0.010%), Pueblo ($36,859, a difference of 0.050%), Navajo ($36,999, a difference of 0.33%), Arapaho ($36,586, a difference of 0.79%), and Tohono O'odham ($36,349, a difference of 1.5%).
| Demographics | Rating | Rank | Median Earnings |
| Houma | 0.0 /100 | #333 | Tragic $38,949 |
| Spanish American Indians | 0.0 /100 | #334 | Tragic $38,907 |
| Natives/Alaskans | 0.0 /100 | #335 | Tragic $38,896 |
| Crow | 0.0 /100 | #336 | Tragic $38,707 |
| Immigrants | Cuba | 0.0 /100 | #337 | Tragic $38,426 |
| Pima | 0.0 /100 | #338 | Tragic $38,285 |
| Menominee | 0.0 /100 | #339 | Tragic $37,884 |
| Navajo | 0.0 /100 | #340 | Tragic $36,999 |
| Lumbee | 0.0 /100 | #341 | Tragic $36,876 |
| Hopi | 0.0 /100 | #342 | Tragic $36,871 |
| Pueblo | 0.0 /100 | #343 | Tragic $36,859 |
| Arapaho | 0.0 /100 | #344 | Tragic $36,586 |
| Tohono O'odham | 0.0 /100 | #345 | Tragic $36,349 |
| Yup'ik | 0.0 /100 | #346 | Tragic $35,942 |
| Puerto Ricans | 0.0 /100 | #347 | Tragic $35,560 |
Demographics Similar to Lebanese by Median Earnings
In terms of median earnings, the demographic groups most similar to Lebanese are Zimbabwean ($48,229, a difference of 0.010%), Pakistani ($48,254, a difference of 0.060%), Immigrants from Philippines ($48,266, a difference of 0.080%), British ($48,189, a difference of 0.080%), and Sierra Leonean ($48,286, a difference of 0.12%).
| Demographics | Rating | Rank | Median Earnings |
| Brazilians | 93.7 /100 | #124 | Exceptional $48,356 |
| Immigrants | Fiji | 93.3 /100 | #125 | Exceptional $48,305 |
| Assyrians/Chaldeans/Syriacs | 93.3 /100 | #126 | Exceptional $48,304 |
| Sierra Leoneans | 93.1 /100 | #127 | Exceptional $48,286 |
| Immigrants | Philippines | 92.9 /100 | #128 | Exceptional $48,266 |
| Pakistanis | 92.8 /100 | #129 | Exceptional $48,254 |
| Zimbabweans | 92.6 /100 | #130 | Exceptional $48,229 |
| Lebanese | 92.5 /100 | #131 | Exceptional $48,226 |
| British | 92.2 /100 | #132 | Exceptional $48,189 |
| Immigrants | Uganda | 90.5 /100 | #133 | Exceptional $48,041 |
| Sri Lankans | 90.5 /100 | #134 | Exceptional $48,040 |
| Portuguese | 90.4 /100 | #135 | Exceptional $48,032 |
| Slovenes | 90.0 /100 | #136 | Excellent $47,995 |
| Immigrants | Nepal | 89.0 /100 | #137 | Excellent $47,925 |
| Europeans | 88.9 /100 | #138 | Excellent $47,915 |