Lumbee vs Immigrants from Africa Median Earnings
COMPARE
Lumbee
Immigrants from Africa
Median Earnings
Median Earnings Comparison
Lumbee
Immigrants from Africa
$36,876
MEDIAN EARNINGS
0.0/ 100
METRIC RATING
341st/ 347
METRIC RANK
$46,564
MEDIAN EARNINGS
54.6/ 100
METRIC RATING
168th/ 347
METRIC RANK
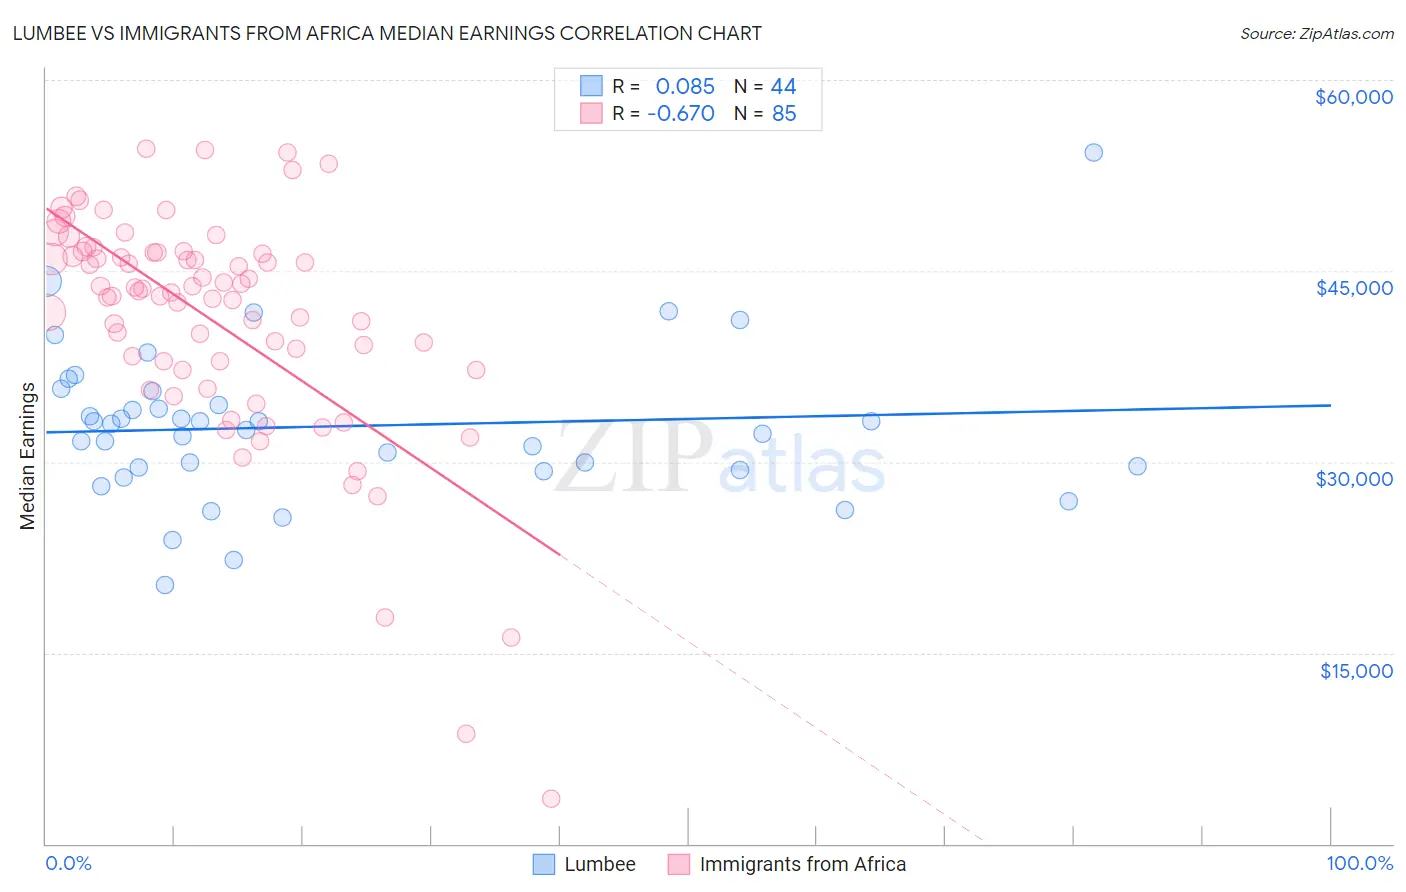
Lumbee vs Immigrants from Africa Median Earnings Correlation Chart
The statistical analysis conducted on geographies consisting of 92,282,036 people shows a slight positive correlation between the proportion of Lumbee and median earnings in the United States with a correlation coefficient (R) of 0.085 and weighted average of $36,876. Similarly, the statistical analysis conducted on geographies consisting of 469,401,841 people shows a significant negative correlation between the proportion of Immigrants from Africa and median earnings in the United States with a correlation coefficient (R) of -0.670 and weighted average of $46,564, a difference of 26.3%.
Median Earnings Correlation Summary
| Measurement | Lumbee | Immigrants from Africa |
| Minimum | $20,337 | $3,500 |
| Maximum | $54,265 | $54,639 |
| Range | $33,928 | $51,139 |
| Mean | $32,791 | $41,149 |
| Median | $32,724 | $43,417 |
| Interquartile 25% (IQ1) | $29,449 | $37,567 |
| Interquartile 75% (IQ3) | $35,034 | $46,460 |
| Interquartile Range (IQR) | $5,585 | $8,893 |
| Standard Deviation (Sample) | $6,085 | $9,174 |
| Standard Deviation (Population) | $6,015 | $9,120 |
Similar Demographics by Median Earnings
Demographics Similar to Lumbee by Median Earnings
In terms of median earnings, the demographic groups most similar to Lumbee are Hopi ($36,871, a difference of 0.010%), Pueblo ($36,859, a difference of 0.050%), Navajo ($36,999, a difference of 0.33%), Arapaho ($36,586, a difference of 0.79%), and Tohono O'odham ($36,349, a difference of 1.5%).
| Demographics | Rating | Rank | Median Earnings |
| Houma | 0.0 /100 | #333 | Tragic $38,949 |
| Spanish American Indians | 0.0 /100 | #334 | Tragic $38,907 |
| Natives/Alaskans | 0.0 /100 | #335 | Tragic $38,896 |
| Crow | 0.0 /100 | #336 | Tragic $38,707 |
| Immigrants | Cuba | 0.0 /100 | #337 | Tragic $38,426 |
| Pima | 0.0 /100 | #338 | Tragic $38,285 |
| Menominee | 0.0 /100 | #339 | Tragic $37,884 |
| Navajo | 0.0 /100 | #340 | Tragic $36,999 |
| Lumbee | 0.0 /100 | #341 | Tragic $36,876 |
| Hopi | 0.0 /100 | #342 | Tragic $36,871 |
| Pueblo | 0.0 /100 | #343 | Tragic $36,859 |
| Arapaho | 0.0 /100 | #344 | Tragic $36,586 |
| Tohono O'odham | 0.0 /100 | #345 | Tragic $36,349 |
| Yup'ik | 0.0 /100 | #346 | Tragic $35,942 |
| Puerto Ricans | 0.0 /100 | #347 | Tragic $35,560 |
Demographics Similar to Immigrants from Africa by Median Earnings
In terms of median earnings, the demographic groups most similar to Immigrants from Africa are Immigrants from South America ($46,548, a difference of 0.030%), Costa Rican ($46,645, a difference of 0.17%), Immigrants ($46,478, a difference of 0.18%), Czechoslovakian ($46,658, a difference of 0.20%), and Scottish ($46,463, a difference of 0.22%).
| Demographics | Rating | Rank | Median Earnings |
| Immigrants | Eastern Africa | 68.0 /100 | #161 | Good $46,969 |
| South American Indians | 67.4 /100 | #162 | Good $46,952 |
| Icelanders | 66.3 /100 | #163 | Good $46,916 |
| Norwegians | 64.7 /100 | #164 | Good $46,865 |
| South Americans | 62.7 /100 | #165 | Good $46,804 |
| Czechoslovakians | 57.8 /100 | #166 | Average $46,658 |
| Costa Ricans | 57.4 /100 | #167 | Average $46,645 |
| Immigrants | Africa | 54.6 /100 | #168 | Average $46,564 |
| Immigrants | South America | 54.0 /100 | #169 | Average $46,548 |
| Immigrants | Immigrants | 51.6 /100 | #170 | Average $46,478 |
| Scottish | 51.1 /100 | #171 | Average $46,463 |
| Kenyans | 51.0 /100 | #172 | Average $46,462 |
| Ghanaians | 50.3 /100 | #173 | Average $46,440 |
| Scandinavians | 50.0 /100 | #174 | Average $46,433 |
| Basques | 48.8 /100 | #175 | Average $46,399 |