Immigrants from Albania vs Alsatian Median Household Income
COMPARE
Immigrants from Albania
Alsatian
Median Household Income
Median Household Income Comparison
Immigrants from Albania
Alsatians
$86,534
MEDIAN HOUSEHOLD INCOME
71.5/ 100
METRIC RATING
156th/ 347
METRIC RANK
$85,053
MEDIAN HOUSEHOLD INCOME
49.2/ 100
METRIC RATING
176th/ 347
METRIC RANK
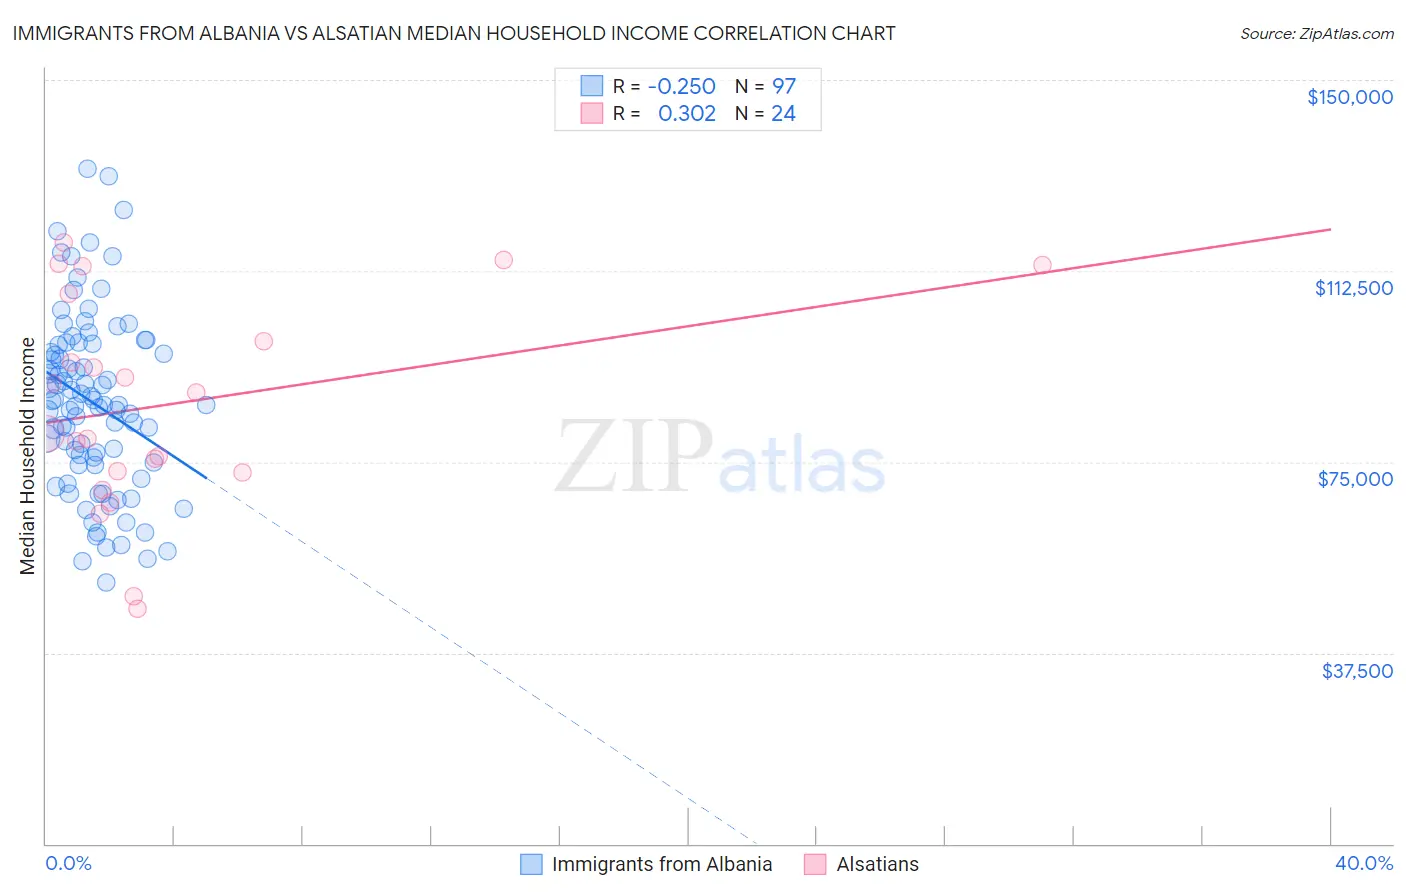
Immigrants from Albania vs Alsatian Median Household Income Correlation Chart
The statistical analysis conducted on geographies consisting of 119,343,332 people shows a weak negative correlation between the proportion of Immigrants from Albania and median household income in the United States with a correlation coefficient (R) of -0.250 and weighted average of $86,534. Similarly, the statistical analysis conducted on geographies consisting of 82,678,631 people shows a mild positive correlation between the proportion of Alsatians and median household income in the United States with a correlation coefficient (R) of 0.302 and weighted average of $85,053, a difference of 1.7%.
Median Household Income Correlation Summary
| Measurement | Immigrants from Albania | Alsatian |
| Minimum | $51,316 | $46,250 |
| Maximum | $132,457 | $118,135 |
| Range | $81,141 | $71,885 |
| Mean | $86,652 | $86,339 |
| Median | $86,175 | $84,486 |
| Interquartile 25% (IQ1) | $74,686 | $73,000 |
| Interquartile 75% (IQ3) | $98,070 | $103,435 |
| Interquartile Range (IQR) | $23,384 | $30,436 |
| Standard Deviation (Sample) | $17,379 | $20,538 |
| Standard Deviation (Population) | $17,290 | $20,105 |
Demographics Similar to Immigrants from Albania and Alsatians by Median Household Income
In terms of median household income, the demographic groups most similar to Immigrants from Albania are Samoan ($86,498, a difference of 0.040%), Moroccan ($86,468, a difference of 0.080%), Immigrants from Uzbekistan ($86,425, a difference of 0.13%), Luxembourger ($86,418, a difference of 0.13%), and Slavic ($86,398, a difference of 0.16%). Similarly, the demographic groups most similar to Alsatians are Immigrants from Costa Rica ($85,054, a difference of 0.0%), Scottish ($85,101, a difference of 0.060%), Immigrants from Cameroon ($85,314, a difference of 0.31%), Slovene ($85,562, a difference of 0.60%), and Immigrants from South America ($85,611, a difference of 0.66%).
| Demographics | Rating | Rank | Median Household Income |
| Immigrants | Albania | 71.5 /100 | #156 | Good $86,534 |
| Samoans | 71.0 /100 | #157 | Good $86,498 |
| Moroccans | 70.6 /100 | #158 | Good $86,468 |
| Immigrants | Uzbekistan | 70.1 /100 | #159 | Good $86,425 |
| Luxembourgers | 70.0 /100 | #160 | Good $86,418 |
| Slavs | 69.7 /100 | #161 | Good $86,398 |
| Guamanians/Chamorros | 67.7 /100 | #162 | Good $86,255 |
| Czechs | 66.4 /100 | #163 | Good $86,164 |
| Irish | 66.2 /100 | #164 | Good $86,145 |
| Norwegians | 65.3 /100 | #165 | Good $86,084 |
| Scandinavians | 65.1 /100 | #166 | Good $86,073 |
| Immigrants | Immigrants | 61.3 /100 | #167 | Good $85,818 |
| Icelanders | 61.0 /100 | #168 | Good $85,797 |
| Colombians | 59.7 /100 | #169 | Average $85,716 |
| Swiss | 59.2 /100 | #170 | Average $85,681 |
| Immigrants | South America | 58.1 /100 | #171 | Average $85,611 |
| Slovenes | 57.4 /100 | #172 | Average $85,562 |
| Immigrants | Cameroon | 53.4 /100 | #173 | Average $85,314 |
| Scottish | 50.0 /100 | #174 | Average $85,101 |
| Immigrants | Costa Rica | 49.2 /100 | #175 | Average $85,054 |
| Alsatians | 49.2 /100 | #176 | Average $85,053 |