Lithuanian vs Immigrants from Afghanistan Unemployment Among Seniors over 65 years
COMPARE
Lithuanian
Immigrants from Afghanistan
Unemployment Among Seniors over 65 years
Unemployment Among Seniors over 65 years Comparison
Lithuanians
Immigrants from Afghanistan
5.1%
UNEMPLOYMENT AMONG SENIORS OVER 65 YEARS
58.2/ 100
METRIC RATING
169th/ 347
METRIC RANK
5.1%
UNEMPLOYMENT AMONG SENIORS OVER 65 YEARS
76.8/ 100
METRIC RATING
149th/ 347
METRIC RANK
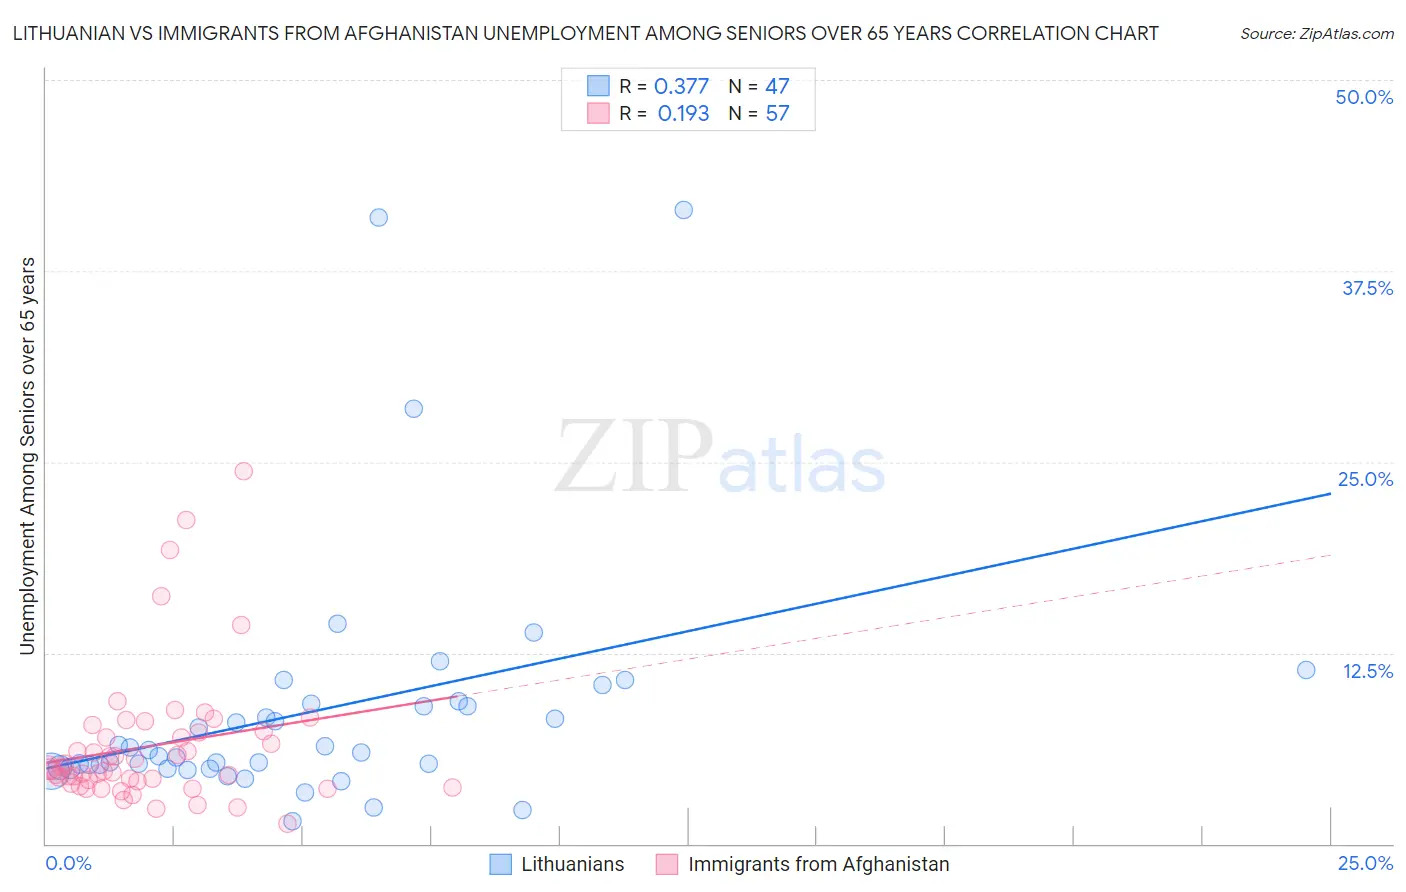
Lithuanian vs Immigrants from Afghanistan Unemployment Among Seniors over 65 years Correlation Chart
The statistical analysis conducted on geographies consisting of 374,267,486 people shows a mild positive correlation between the proportion of Lithuanians and unemployment rate amomg seniors over the age of 65 in the United States with a correlation coefficient (R) of 0.377 and weighted average of 5.1%. Similarly, the statistical analysis conducted on geographies consisting of 142,603,246 people shows a poor positive correlation between the proportion of Immigrants from Afghanistan and unemployment rate amomg seniors over the age of 65 in the United States with a correlation coefficient (R) of 0.193 and weighted average of 5.1%, a difference of 0.70%.
Unemployment Among Seniors over 65 years Correlation Summary
| Measurement | Lithuanian | Immigrants from Afghanistan |
| Minimum | 1.5% | 1.3% |
| Maximum | 41.5% | 24.4% |
| Range | 40.0% | 23.1% |
| Mean | 8.7% | 6.4% |
| Median | 6.0% | 4.9% |
| Interquartile 25% (IQ1) | 4.9% | 4.0% |
| Interquartile 75% (IQ3) | 9.2% | 7.3% |
| Interquartile Range (IQR) | 4.3% | 3.3% |
| Standard Deviation (Sample) | 8.1% | 4.5% |
| Standard Deviation (Population) | 8.1% | 4.4% |
Demographics Similar to Lithuanians and Immigrants from Afghanistan by Unemployment Among Seniors over 65 years
In terms of unemployment among seniors over 65 years, the demographic groups most similar to Lithuanians are Mongolian (5.1%, a difference of 0.050%), Immigrants from Western Europe (5.1%, a difference of 0.070%), Immigrants from Laos (5.1%, a difference of 0.19%), Immigrants from Ukraine (5.1%, a difference of 0.20%), and Potawatomi (5.1%, a difference of 0.21%). Similarly, the demographic groups most similar to Immigrants from Afghanistan are Immigrants from Asia (5.1%, a difference of 0.050%), Pakistani (5.1%, a difference of 0.060%), Canadian (5.1%, a difference of 0.090%), Immigrants from Czechoslovakia (5.1%, a difference of 0.10%), and Immigrants from Hong Kong (5.1%, a difference of 0.12%).
| Demographics | Rating | Rank | Unemployment Among Seniors over 65 years |
| Immigrants | Afghanistan | 76.8 /100 | #149 | Good 5.1% |
| Immigrants | Asia | 75.6 /100 | #150 | Good 5.1% |
| Pakistanis | 75.5 /100 | #151 | Good 5.1% |
| Canadians | 74.7 /100 | #152 | Good 5.1% |
| Immigrants | Czechoslovakia | 74.5 /100 | #153 | Good 5.1% |
| Immigrants | Hong Kong | 74.0 /100 | #154 | Good 5.1% |
| Basques | 72.9 /100 | #155 | Good 5.1% |
| Immigrants | Romania | 72.4 /100 | #156 | Good 5.1% |
| Immigrants | Northern Europe | 69.8 /100 | #157 | Good 5.1% |
| Immigrants | Belarus | 69.0 /100 | #158 | Good 5.1% |
| Immigrants | France | 68.6 /100 | #159 | Good 5.1% |
| French | 68.1 /100 | #160 | Good 5.1% |
| Immigrants | Bosnia and Herzegovina | 66.1 /100 | #161 | Good 5.1% |
| Immigrants | South Eastern Asia | 65.6 /100 | #162 | Good 5.1% |
| Potawatomi | 64.5 /100 | #163 | Good 5.1% |
| Nepalese | 64.5 /100 | #164 | Good 5.1% |
| Immigrants | Ukraine | 64.2 /100 | #165 | Good 5.1% |
| Immigrants | Laos | 63.8 /100 | #166 | Good 5.1% |
| Immigrants | Western Europe | 60.4 /100 | #167 | Good 5.1% |
| Mongolians | 59.8 /100 | #168 | Average 5.1% |
| Lithuanians | 58.2 /100 | #169 | Average 5.1% |