Lithuanian vs Immigrants from Afghanistan Master's Degree
COMPARE
Lithuanian
Immigrants from Afghanistan
Master's Degree
Master's Degree Comparison
Lithuanians
Immigrants from Afghanistan
17.7%
MASTER'S DEGREE
99.7/ 100
METRIC RATING
72nd/ 347
METRIC RANK
15.6%
MASTER'S DEGREE
79.4/ 100
METRIC RATING
146th/ 347
METRIC RANK
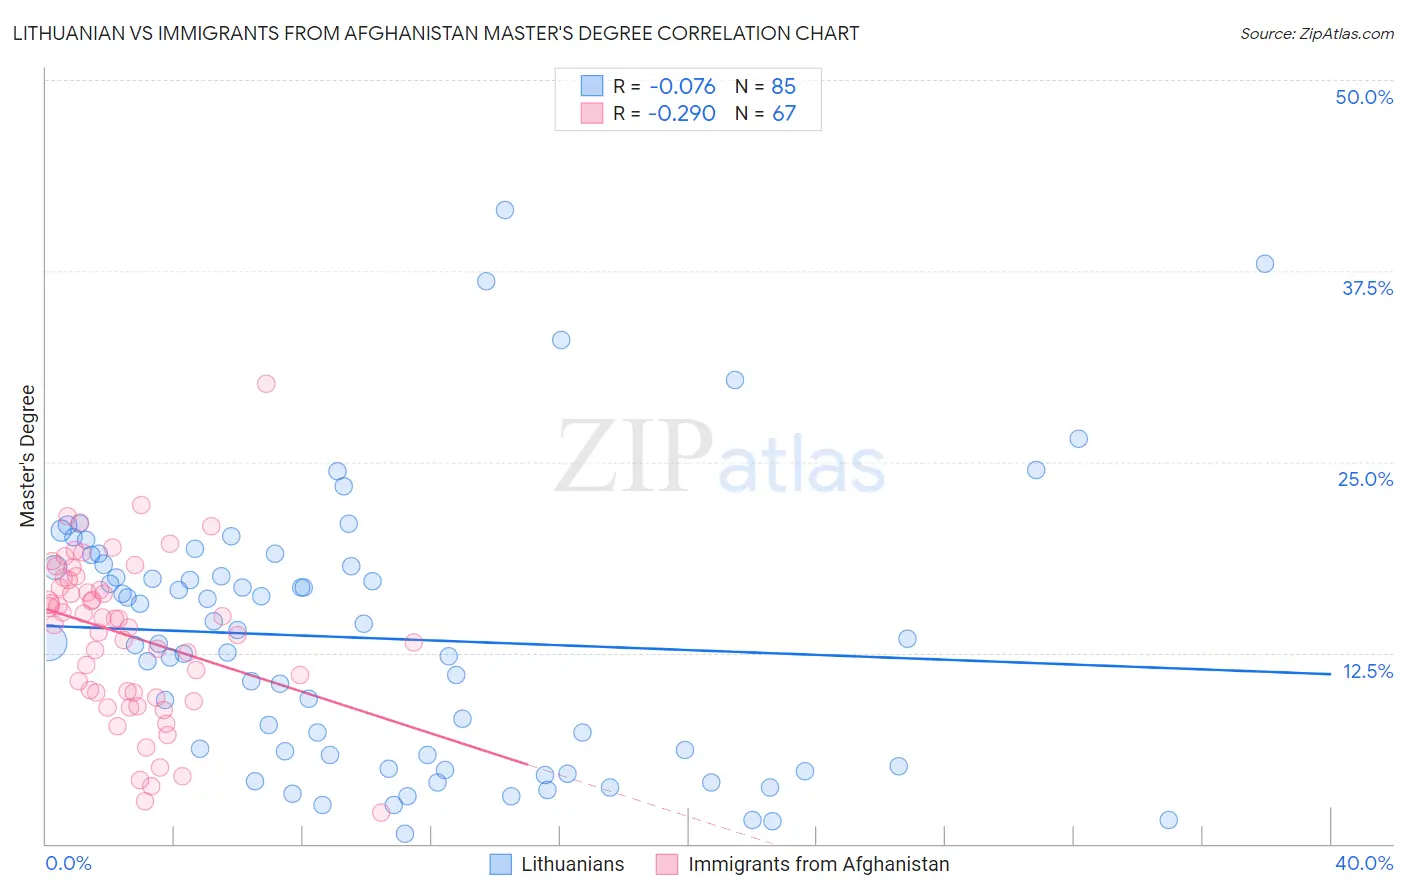
Lithuanian vs Immigrants from Afghanistan Master's Degree Correlation Chart
The statistical analysis conducted on geographies consisting of 421,813,641 people shows a slight negative correlation between the proportion of Lithuanians and percentage of population with at least master's degree education in the United States with a correlation coefficient (R) of -0.076 and weighted average of 17.7%. Similarly, the statistical analysis conducted on geographies consisting of 147,637,931 people shows a weak negative correlation between the proportion of Immigrants from Afghanistan and percentage of population with at least master's degree education in the United States with a correlation coefficient (R) of -0.290 and weighted average of 15.6%, a difference of 14.0%.
Master's Degree Correlation Summary
| Measurement | Lithuanian | Immigrants from Afghanistan |
| Minimum | 0.63% | 2.0% |
| Maximum | 41.5% | 30.1% |
| Range | 40.9% | 28.1% |
| Mean | 13.5% | 13.6% |
| Median | 13.2% | 14.7% |
| Interquartile 25% (IQ1) | 5.4% | 9.9% |
| Interquartile 75% (IQ3) | 18.2% | 17.3% |
| Interquartile Range (IQR) | 12.8% | 7.4% |
| Standard Deviation (Sample) | 8.8% | 5.3% |
| Standard Deviation (Population) | 8.7% | 5.2% |
Similar Demographics by Master's Degree
Demographics Similar to Lithuanians by Master's Degree
In terms of master's degree, the demographic groups most similar to Lithuanians are Zimbabwean (17.7%, a difference of 0.11%), Immigrants from Pakistan (17.8%, a difference of 0.17%), Immigrants from Romania (17.7%, a difference of 0.41%), Immigrants from Western Europe (17.8%, a difference of 0.46%), and Immigrants from Uzbekistan (17.9%, a difference of 0.67%).
| Demographics | Rating | Rank | Master's Degree |
| Immigrants | Kazakhstan | 99.8 /100 | #65 | Exceptional 18.0% |
| Ethiopians | 99.8 /100 | #66 | Exceptional 18.0% |
| Immigrants | Argentina | 99.8 /100 | #67 | Exceptional 18.0% |
| Immigrants | Ethiopia | 99.8 /100 | #68 | Exceptional 17.9% |
| Immigrants | Uzbekistan | 99.8 /100 | #69 | Exceptional 17.9% |
| Immigrants | Western Europe | 99.8 /100 | #70 | Exceptional 17.8% |
| Immigrants | Pakistan | 99.7 /100 | #71 | Exceptional 17.8% |
| Lithuanians | 99.7 /100 | #72 | Exceptional 17.7% |
| Zimbabweans | 99.7 /100 | #73 | Exceptional 17.7% |
| Immigrants | Romania | 99.7 /100 | #74 | Exceptional 17.7% |
| Egyptians | 99.6 /100 | #75 | Exceptional 17.6% |
| Immigrants | Indonesia | 99.6 /100 | #76 | Exceptional 17.6% |
| Immigrants | Eastern Europe | 99.6 /100 | #77 | Exceptional 17.6% |
| Immigrants | Hungary | 99.6 /100 | #78 | Exceptional 17.5% |
| Immigrants | Lebanon | 99.6 /100 | #79 | Exceptional 17.5% |
Demographics Similar to Immigrants from Afghanistan by Master's Degree
In terms of master's degree, the demographic groups most similar to Immigrants from Afghanistan are Hungarian (15.6%, a difference of 0.040%), Immigrants from Senegal (15.5%, a difference of 0.21%), Ghanaian (15.5%, a difference of 0.22%), Slovene (15.5%, a difference of 0.25%), and South American (15.6%, a difference of 0.37%).
| Demographics | Rating | Rank | Master's Degree |
| Immigrants | Germany | 85.9 /100 | #139 | Excellent 15.8% |
| Vietnamese | 85.5 /100 | #140 | Excellent 15.8% |
| Poles | 85.0 /100 | #141 | Excellent 15.7% |
| Immigrants | Africa | 84.0 /100 | #142 | Excellent 15.7% |
| Immigrants | Venezuela | 83.6 /100 | #143 | Excellent 15.7% |
| Canadians | 83.3 /100 | #144 | Excellent 15.7% |
| South Americans | 81.3 /100 | #145 | Excellent 15.6% |
| Immigrants | Afghanistan | 79.4 /100 | #146 | Good 15.6% |
| Hungarians | 79.1 /100 | #147 | Good 15.6% |
| Immigrants | Senegal | 78.2 /100 | #148 | Good 15.5% |
| Ghanaians | 78.2 /100 | #149 | Good 15.5% |
| Slovenes | 78.0 /100 | #150 | Good 15.5% |
| Iraqis | 77.3 /100 | #151 | Good 15.5% |
| Slavs | 77.0 /100 | #152 | Good 15.5% |
| Icelanders | 76.8 /100 | #153 | Good 15.5% |