Liberian vs Albanian Median Family Income
COMPARE
Liberian
Albanian
Median Family Income
Median Family Income Comparison
Liberians
Albanians
$91,722
MEDIAN FAMILY INCOME
0.4/ 100
METRIC RATING
262nd/ 347
METRIC RANK
$109,136
MEDIAN FAMILY INCOME
96.4/ 100
METRIC RATING
106th/ 347
METRIC RANK
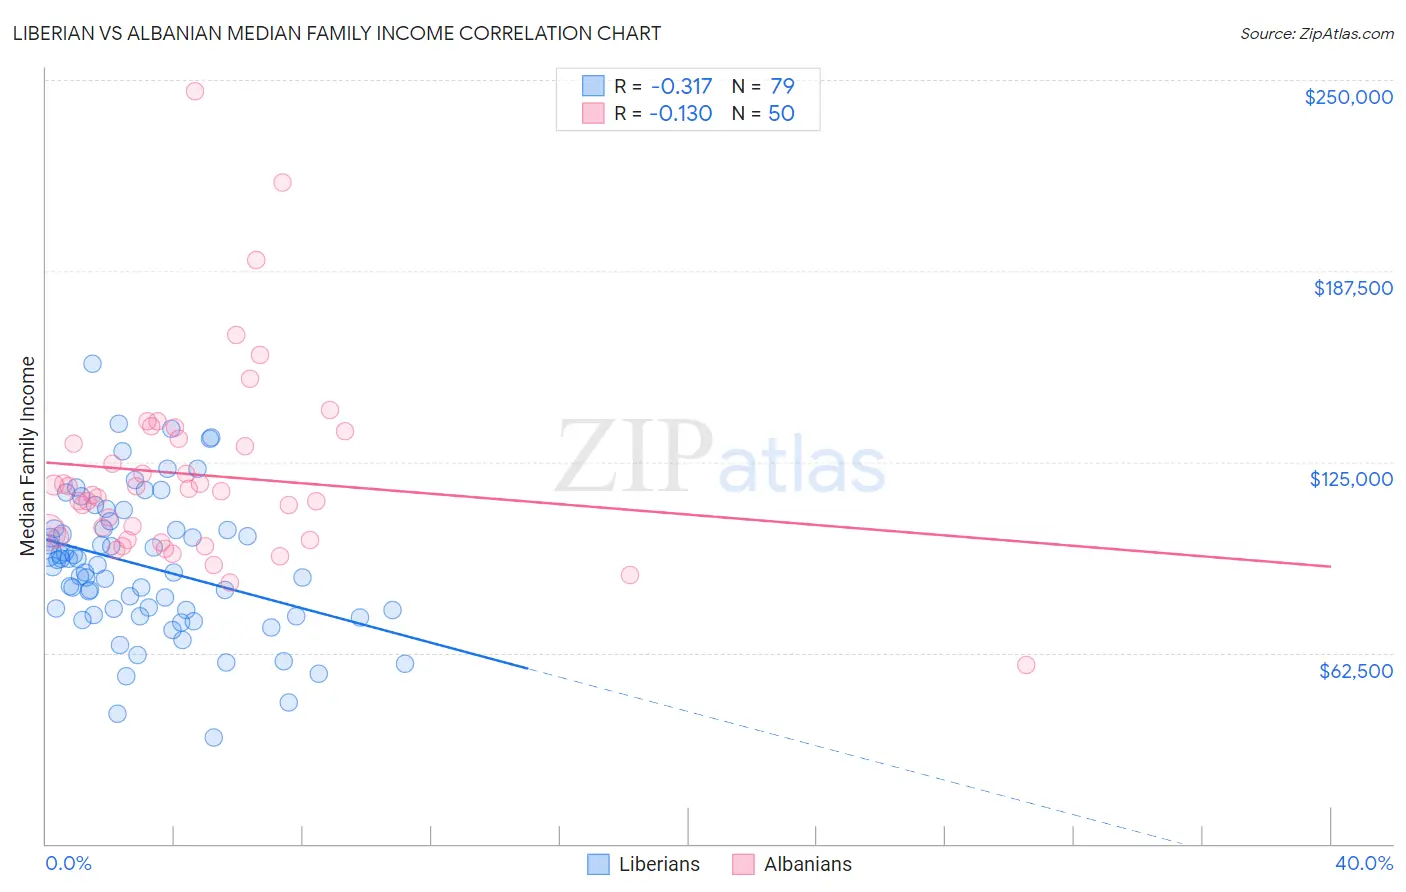
Liberian vs Albanian Median Family Income Correlation Chart
The statistical analysis conducted on geographies consisting of 118,024,273 people shows a mild negative correlation between the proportion of Liberians and median family income in the United States with a correlation coefficient (R) of -0.317 and weighted average of $91,722. Similarly, the statistical analysis conducted on geographies consisting of 193,155,793 people shows a poor negative correlation between the proportion of Albanians and median family income in the United States with a correlation coefficient (R) of -0.130 and weighted average of $109,136, a difference of 19.0%.
Median Family Income Correlation Summary
| Measurement | Liberian | Albanian |
| Minimum | $34,978 | $58,625 |
| Maximum | $157,083 | $246,215 |
| Range | $122,105 | $187,590 |
| Mean | $90,813 | $120,773 |
| Median | $90,810 | $114,864 |
| Interquartile 25% (IQ1) | $74,960 | $99,531 |
| Interquartile 75% (IQ3) | $103,000 | $132,647 |
| Interquartile Range (IQR) | $28,040 | $33,116 |
| Standard Deviation (Sample) | $23,045 | $32,208 |
| Standard Deviation (Population) | $22,899 | $31,885 |
Similar Demographics by Median Family Income
Demographics Similar to Liberians by Median Family Income
In terms of median family income, the demographic groups most similar to Liberians are Inupiat ($91,730, a difference of 0.010%), Pennsylvania German ($91,763, a difference of 0.040%), Cape Verdean ($91,848, a difference of 0.14%), Immigrants from West Indies ($91,588, a difference of 0.15%), and Osage ($91,926, a difference of 0.22%).
| Demographics | Rating | Rank | Median Family Income |
| Immigrants | Laos | 0.5 /100 | #255 | Tragic $92,239 |
| Nicaraguans | 0.5 /100 | #256 | Tragic $92,231 |
| Americans | 0.4 /100 | #257 | Tragic $92,096 |
| Osage | 0.4 /100 | #258 | Tragic $91,926 |
| Cape Verdeans | 0.4 /100 | #259 | Tragic $91,848 |
| Pennsylvania Germans | 0.4 /100 | #260 | Tragic $91,763 |
| Inupiat | 0.4 /100 | #261 | Tragic $91,730 |
| Liberians | 0.4 /100 | #262 | Tragic $91,722 |
| Immigrants | West Indies | 0.3 /100 | #263 | Tragic $91,588 |
| Senegalese | 0.3 /100 | #264 | Tragic $91,475 |
| Hmong | 0.3 /100 | #265 | Tragic $91,296 |
| Central Americans | 0.3 /100 | #266 | Tragic $91,087 |
| Mexican American Indians | 0.2 /100 | #267 | Tragic $90,918 |
| Cree | 0.2 /100 | #268 | Tragic $90,882 |
| Belizeans | 0.2 /100 | #269 | Tragic $90,880 |
Demographics Similar to Albanians by Median Family Income
In terms of median family income, the demographic groups most similar to Albanians are Immigrants from North Macedonia ($109,136, a difference of 0.0%), Syrian ($109,299, a difference of 0.15%), Palestinian ($109,413, a difference of 0.25%), Immigrants from Brazil ($109,418, a difference of 0.26%), and Immigrants from Zimbabwe ($108,830, a difference of 0.28%).
| Demographics | Rating | Rank | Median Family Income |
| Armenians | 97.3 /100 | #99 | Exceptional $109,692 |
| Macedonians | 97.3 /100 | #100 | Exceptional $109,668 |
| Immigrants | Ukraine | 97.2 /100 | #101 | Exceptional $109,645 |
| Assyrians/Chaldeans/Syriacs | 97.2 /100 | #102 | Exceptional $109,622 |
| Immigrants | Brazil | 96.9 /100 | #103 | Exceptional $109,418 |
| Palestinians | 96.9 /100 | #104 | Exceptional $109,413 |
| Syrians | 96.7 /100 | #105 | Exceptional $109,299 |
| Albanians | 96.4 /100 | #106 | Exceptional $109,136 |
| Immigrants | North Macedonia | 96.4 /100 | #107 | Exceptional $109,136 |
| Immigrants | Zimbabwe | 95.9 /100 | #108 | Exceptional $108,830 |
| Immigrants | Afghanistan | 95.6 /100 | #109 | Exceptional $108,709 |
| British | 95.6 /100 | #110 | Exceptional $108,705 |
| Immigrants | Western Asia | 95.6 /100 | #111 | Exceptional $108,691 |
| Immigrants | Poland | 95.3 /100 | #112 | Exceptional $108,570 |
| Immigrants | Saudi Arabia | 95.2 /100 | #113 | Exceptional $108,544 |