Liberian vs Immigrants from Cambodia Median Family Income
COMPARE
Liberian
Immigrants from Cambodia
Median Family Income
Median Family Income Comparison
Liberians
Immigrants from Cambodia
$91,722
MEDIAN FAMILY INCOME
0.4/ 100
METRIC RATING
262nd/ 347
METRIC RANK
$97,222
MEDIAN FAMILY INCOME
5.8/ 100
METRIC RATING
218th/ 347
METRIC RANK
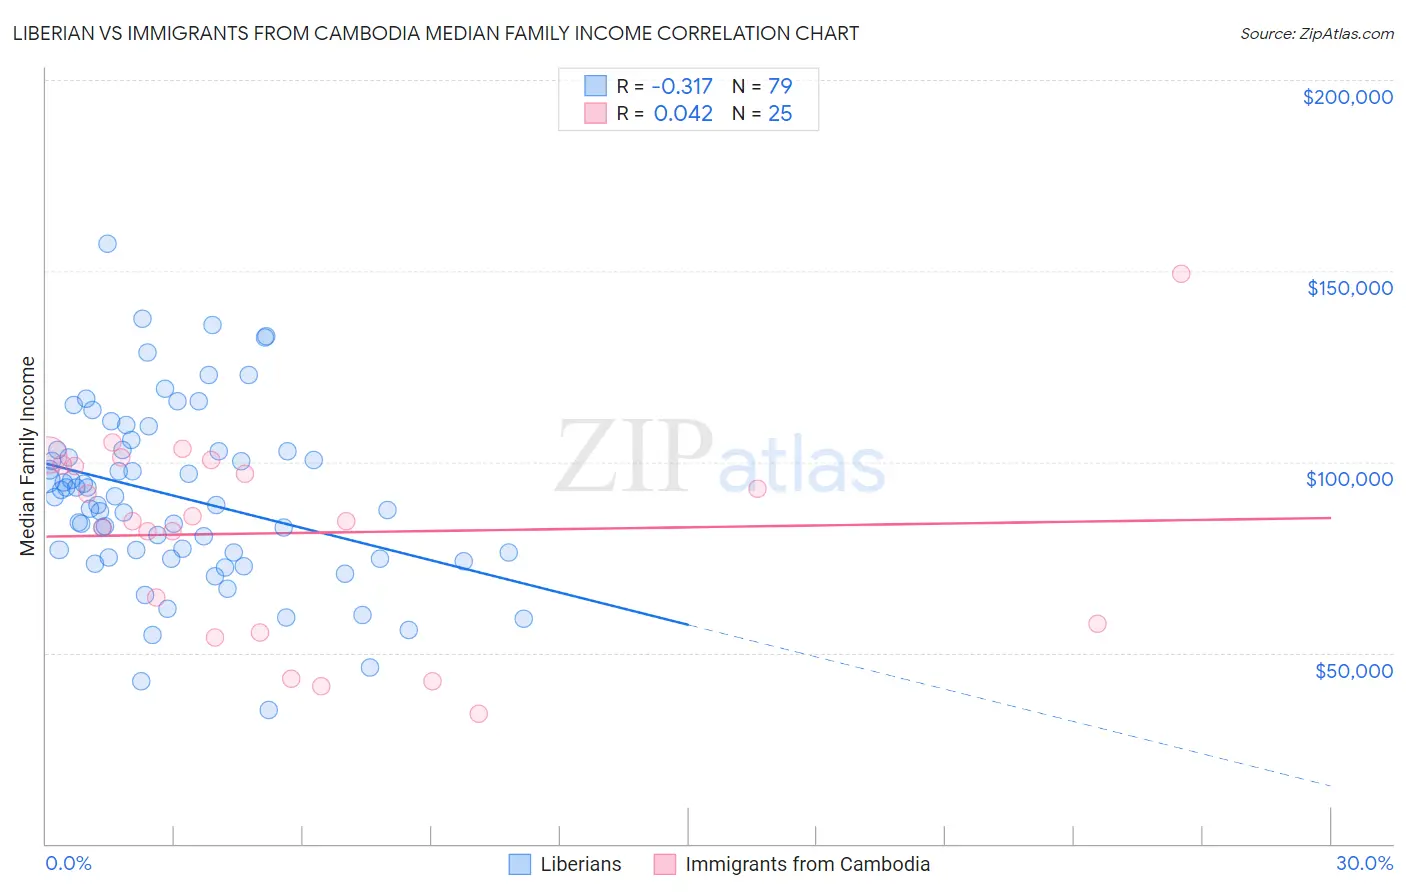
Liberian vs Immigrants from Cambodia Median Family Income Correlation Chart
The statistical analysis conducted on geographies consisting of 118,024,273 people shows a mild negative correlation between the proportion of Liberians and median family income in the United States with a correlation coefficient (R) of -0.317 and weighted average of $91,722. Similarly, the statistical analysis conducted on geographies consisting of 205,119,911 people shows no correlation between the proportion of Immigrants from Cambodia and median family income in the United States with a correlation coefficient (R) of 0.042 and weighted average of $97,222, a difference of 6.0%.
Median Family Income Correlation Summary
| Measurement | Liberian | Immigrants from Cambodia |
| Minimum | $34,978 | $34,076 |
| Maximum | $157,083 | $149,239 |
| Range | $122,105 | $115,163 |
| Mean | $90,813 | $81,395 |
| Median | $90,810 | $84,615 |
| Interquartile 25% (IQ1) | $74,960 | $56,570 |
| Interquartile 75% (IQ3) | $103,000 | $99,835 |
| Interquartile Range (IQR) | $28,040 | $43,265 |
| Standard Deviation (Sample) | $23,045 | $26,680 |
| Standard Deviation (Population) | $22,899 | $26,141 |
Similar Demographics by Median Family Income
Demographics Similar to Liberians by Median Family Income
In terms of median family income, the demographic groups most similar to Liberians are Inupiat ($91,730, a difference of 0.010%), Pennsylvania German ($91,763, a difference of 0.040%), Cape Verdean ($91,848, a difference of 0.14%), Immigrants from West Indies ($91,588, a difference of 0.15%), and Osage ($91,926, a difference of 0.22%).
| Demographics | Rating | Rank | Median Family Income |
| Immigrants | Laos | 0.5 /100 | #255 | Tragic $92,239 |
| Nicaraguans | 0.5 /100 | #256 | Tragic $92,231 |
| Americans | 0.4 /100 | #257 | Tragic $92,096 |
| Osage | 0.4 /100 | #258 | Tragic $91,926 |
| Cape Verdeans | 0.4 /100 | #259 | Tragic $91,848 |
| Pennsylvania Germans | 0.4 /100 | #260 | Tragic $91,763 |
| Inupiat | 0.4 /100 | #261 | Tragic $91,730 |
| Liberians | 0.4 /100 | #262 | Tragic $91,722 |
| Immigrants | West Indies | 0.3 /100 | #263 | Tragic $91,588 |
| Senegalese | 0.3 /100 | #264 | Tragic $91,475 |
| Hmong | 0.3 /100 | #265 | Tragic $91,296 |
| Central Americans | 0.3 /100 | #266 | Tragic $91,087 |
| Mexican American Indians | 0.2 /100 | #267 | Tragic $90,918 |
| Cree | 0.2 /100 | #268 | Tragic $90,882 |
| Belizeans | 0.2 /100 | #269 | Tragic $90,880 |
Demographics Similar to Immigrants from Cambodia by Median Family Income
In terms of median family income, the demographic groups most similar to Immigrants from Cambodia are Japanese ($97,288, a difference of 0.070%), Immigrants from Bosnia and Herzegovina ($97,432, a difference of 0.22%), Delaware ($96,958, a difference of 0.27%), Nigerian ($97,522, a difference of 0.31%), and Bermudan ($97,577, a difference of 0.36%).
| Demographics | Rating | Rank | Median Family Income |
| Immigrants | Sudan | 7.4 /100 | #211 | Tragic $97,737 |
| Panamanians | 7.2 /100 | #212 | Tragic $97,683 |
| Immigrants | Armenia | 7.0 /100 | #213 | Tragic $97,605 |
| Bermudans | 6.9 /100 | #214 | Tragic $97,577 |
| Nigerians | 6.7 /100 | #215 | Tragic $97,522 |
| Immigrants | Bosnia and Herzegovina | 6.4 /100 | #216 | Tragic $97,432 |
| Japanese | 6.0 /100 | #217 | Tragic $97,288 |
| Immigrants | Cambodia | 5.8 /100 | #218 | Tragic $97,222 |
| Delaware | 5.1 /100 | #219 | Tragic $96,958 |
| Sudanese | 4.7 /100 | #220 | Tragic $96,783 |
| Immigrants | Ghana | 4.2 /100 | #221 | Tragic $96,544 |
| Immigrants | Nigeria | 4.0 /100 | #222 | Tragic $96,439 |
| Venezuelans | 3.7 /100 | #223 | Tragic $96,281 |
| Immigrants | Nonimmigrants | 3.6 /100 | #224 | Tragic $96,231 |
| Vietnamese | 3.4 /100 | #225 | Tragic $96,123 |