Liberian vs Yugoslavian 5th Grade
COMPARE
Liberian
Yugoslavian
5th Grade
5th Grade Comparison
Liberians
Yugoslavians
97.0%
5TH GRADE
5.7/ 100
METRIC RATING
223rd/ 347
METRIC RANK
97.7%
5TH GRADE
98.3/ 100
METRIC RATING
98th/ 347
METRIC RANK
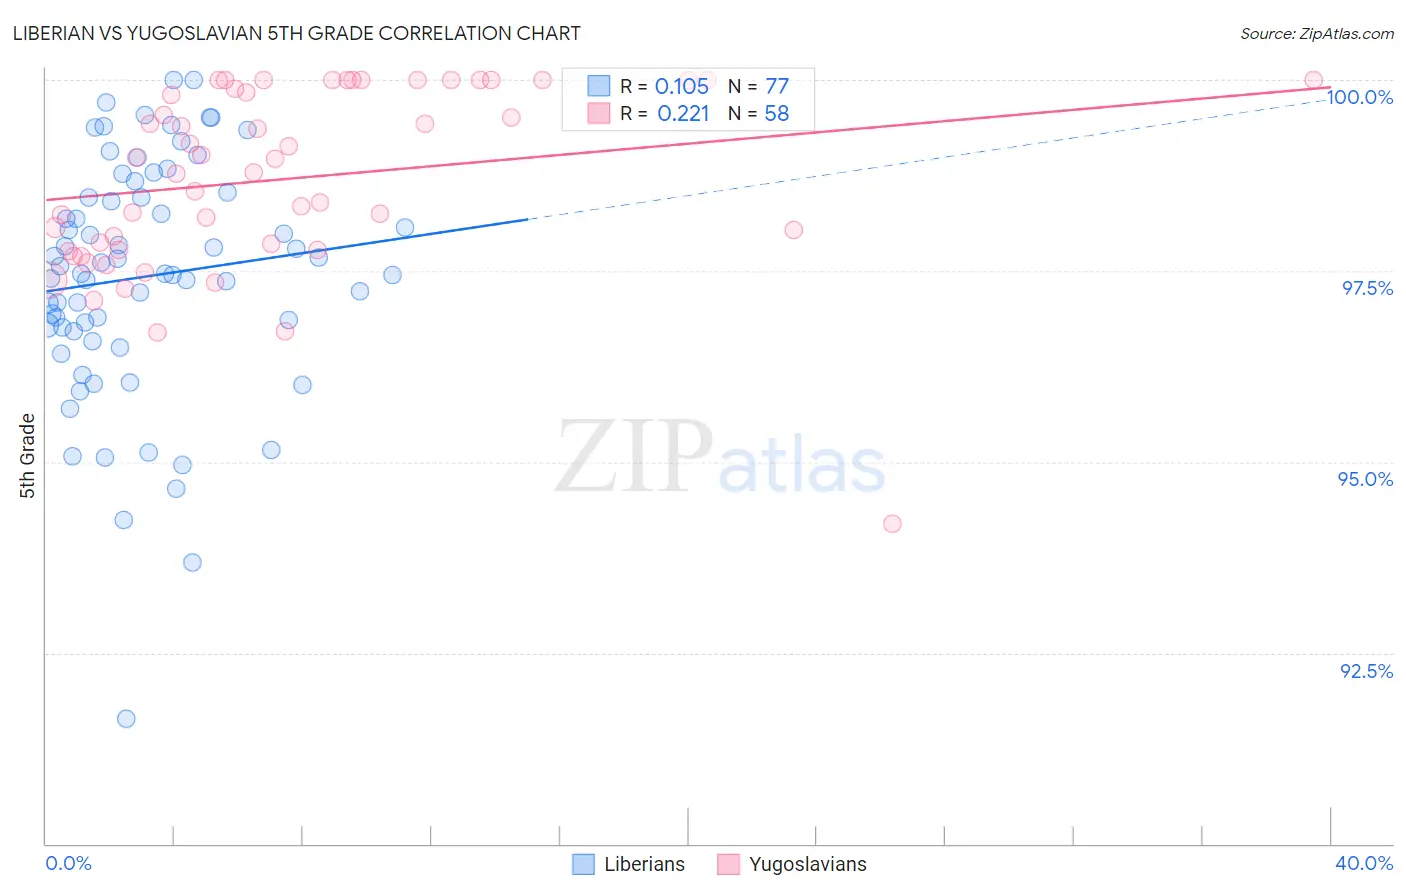
Liberian vs Yugoslavian 5th Grade Correlation Chart
The statistical analysis conducted on geographies consisting of 118,085,461 people shows a poor positive correlation between the proportion of Liberians and percentage of population with at least 5th grade education in the United States with a correlation coefficient (R) of 0.105 and weighted average of 97.0%. Similarly, the statistical analysis conducted on geographies consisting of 285,618,157 people shows a weak positive correlation between the proportion of Yugoslavians and percentage of population with at least 5th grade education in the United States with a correlation coefficient (R) of 0.221 and weighted average of 97.7%, a difference of 0.72%.
5th Grade Correlation Summary
| Measurement | Liberian | Yugoslavian |
| Minimum | 91.6% | 94.2% |
| Maximum | 100.0% | 100.0% |
| Range | 8.4% | 5.8% |
| Mean | 97.4% | 98.7% |
| Median | 97.5% | 98.9% |
| Interquartile 25% (IQ1) | 96.7% | 97.8% |
| Interquartile 75% (IQ3) | 98.5% | 100.0% |
| Interquartile Range (IQR) | 1.8% | 2.2% |
| Standard Deviation (Sample) | 1.6% | 1.2% |
| Standard Deviation (Population) | 1.6% | 1.2% |
Similar Demographics by 5th Grade
Demographics Similar to Liberians by 5th Grade
In terms of 5th grade, the demographic groups most similar to Liberians are Immigrants from Panama (97.0%, a difference of 0.0%), South American Indian (97.0%, a difference of 0.0%), Immigrants from Syria (97.1%, a difference of 0.010%), Immigrants from Southern Europe (97.1%, a difference of 0.010%), and Sierra Leonean (97.1%, a difference of 0.010%).
| Demographics | Rating | Rank | 5th Grade |
| Sudanese | 7.0 /100 | #216 | Tragic 97.1% |
| Immigrants | Lebanon | 6.8 /100 | #217 | Tragic 97.1% |
| Immigrants | Sudan | 6.5 /100 | #218 | Tragic 97.1% |
| Immigrants | Syria | 6.4 /100 | #219 | Tragic 97.1% |
| Immigrants | Southern Europe | 6.3 /100 | #220 | Tragic 97.1% |
| Sierra Leoneans | 6.0 /100 | #221 | Tragic 97.1% |
| Immigrants | Panama | 5.7 /100 | #222 | Tragic 97.0% |
| Liberians | 5.7 /100 | #223 | Tragic 97.0% |
| South American Indians | 5.4 /100 | #224 | Tragic 97.0% |
| Bahamians | 5.3 /100 | #225 | Tragic 97.0% |
| Tongans | 5.3 /100 | #226 | Tragic 97.0% |
| Immigrants | Pakistan | 4.7 /100 | #227 | Tragic 97.0% |
| Assyrians/Chaldeans/Syriacs | 4.5 /100 | #228 | Tragic 97.0% |
| Yuman | 4.5 /100 | #229 | Tragic 97.0% |
| Immigrants | Western Asia | 4.3 /100 | #230 | Tragic 97.0% |
Demographics Similar to Yugoslavians by 5th Grade
In terms of 5th grade, the demographic groups most similar to Yugoslavians are Turkish (97.7%, a difference of 0.0%), Puget Sound Salish (97.7%, a difference of 0.0%), South African (97.7%, a difference of 0.0%), Immigrants from Germany (97.8%, a difference of 0.010%), and Cree (97.7%, a difference of 0.010%).
| Demographics | Rating | Rank | 5th Grade |
| Immigrants | Western Europe | 98.8 /100 | #91 | Exceptional 97.8% |
| Immigrants | Sweden | 98.7 /100 | #92 | Exceptional 97.8% |
| Delaware | 98.6 /100 | #93 | Exceptional 97.8% |
| Immigrants | Denmark | 98.6 /100 | #94 | Exceptional 97.8% |
| Romanians | 98.6 /100 | #95 | Exceptional 97.8% |
| Immigrants | Germany | 98.5 /100 | #96 | Exceptional 97.8% |
| Cree | 98.4 /100 | #97 | Exceptional 97.7% |
| Yugoslavians | 98.3 /100 | #98 | Exceptional 97.7% |
| Turks | 98.3 /100 | #99 | Exceptional 97.7% |
| Puget Sound Salish | 98.3 /100 | #100 | Exceptional 97.7% |
| South Africans | 98.3 /100 | #101 | Exceptional 97.7% |
| Choctaw | 98.0 /100 | #102 | Exceptional 97.7% |
| Cheyenne | 97.9 /100 | #103 | Exceptional 97.7% |
| German Russians | 97.8 /100 | #104 | Exceptional 97.7% |
| Bhutanese | 97.6 /100 | #105 | Exceptional 97.7% |