Liberian vs Immigrants from Nigeria 6th Grade
COMPARE
Liberian
Immigrants from Nigeria
6th Grade
6th Grade Comparison
Liberians
Immigrants from Nigeria
96.8%
6TH GRADE
7.5/ 100
METRIC RATING
217th/ 347
METRIC RANK
96.4%
6TH GRADE
0.3/ 100
METRIC RATING
262nd/ 347
METRIC RANK
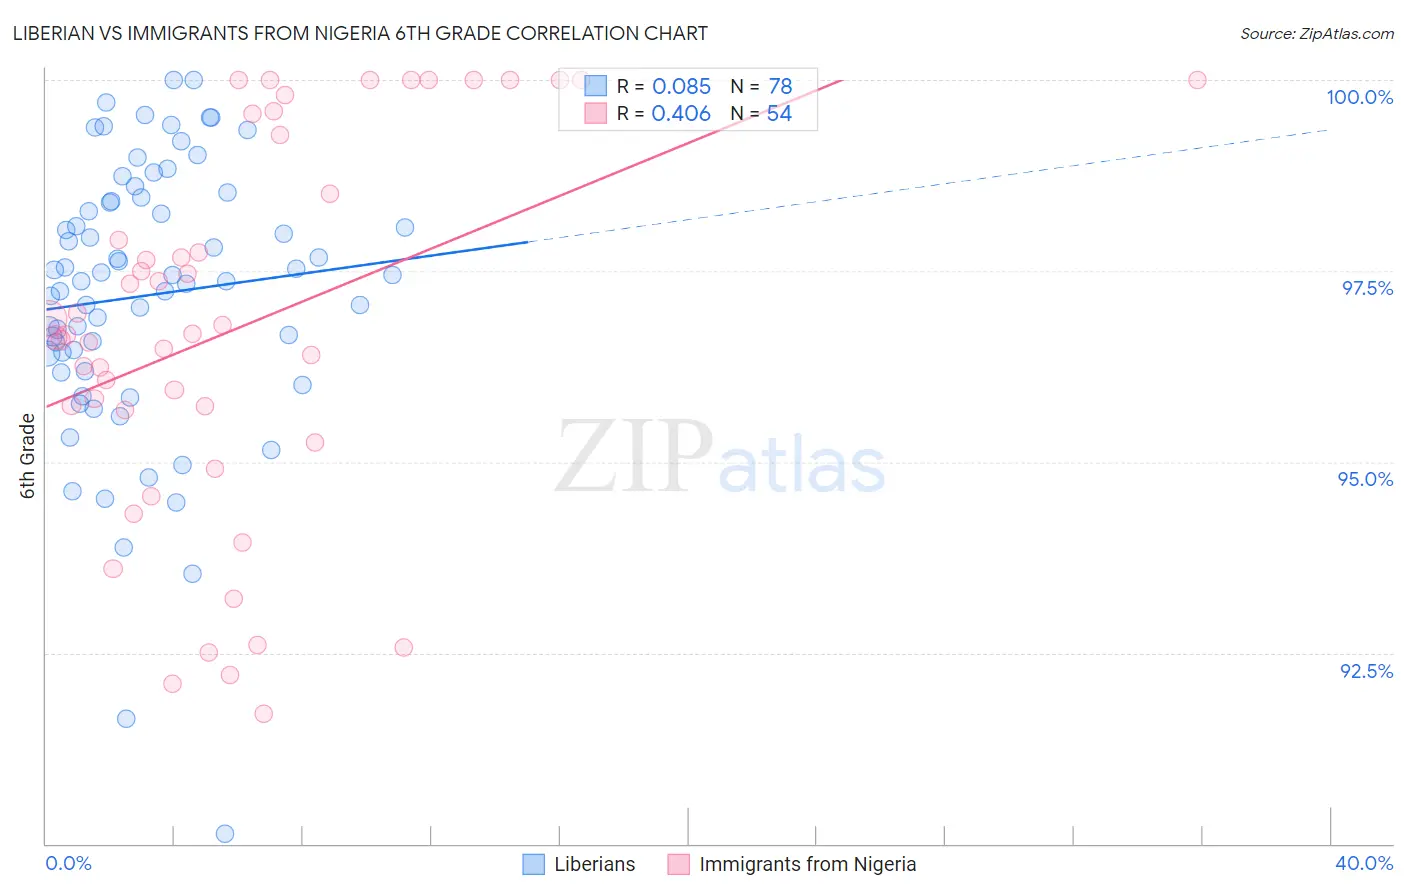
Liberian vs Immigrants from Nigeria 6th Grade Correlation Chart
The statistical analysis conducted on geographies consisting of 118,098,536 people shows a slight positive correlation between the proportion of Liberians and percentage of population with at least 6th grade education in the United States with a correlation coefficient (R) of 0.085 and weighted average of 96.8%. Similarly, the statistical analysis conducted on geographies consisting of 283,430,369 people shows a moderate positive correlation between the proportion of Immigrants from Nigeria and percentage of population with at least 6th grade education in the United States with a correlation coefficient (R) of 0.406 and weighted average of 96.4%, a difference of 0.38%.
6th Grade Correlation Summary
| Measurement | Liberian | Immigrants from Nigeria |
| Minimum | 90.1% | 91.7% |
| Maximum | 100.0% | 100.0% |
| Range | 9.9% | 8.3% |
| Mean | 97.2% | 96.8% |
| Median | 97.4% | 96.7% |
| Interquartile 25% (IQ1) | 96.4% | 95.7% |
| Interquartile 75% (IQ3) | 98.4% | 99.3% |
| Interquartile Range (IQR) | 2.0% | 3.6% |
| Standard Deviation (Sample) | 1.8% | 2.5% |
| Standard Deviation (Population) | 1.8% | 2.4% |
Similar Demographics by 6th Grade
Demographics Similar to Liberians by 6th Grade
In terms of 6th grade, the demographic groups most similar to Liberians are Navajo (96.8%, a difference of 0.0%), Portuguese (96.8%, a difference of 0.010%), Sierra Leonean (96.8%, a difference of 0.010%), Paiute (96.8%, a difference of 0.010%), and Costa Rican (96.8%, a difference of 0.010%).
| Demographics | Rating | Rank | 6th Grade |
| Immigrants | Nepal | 10.1 /100 | #210 | Poor 96.8% |
| Immigrants | Iraq | 9.2 /100 | #211 | Tragic 96.8% |
| Moroccans | 9.0 /100 | #212 | Tragic 96.8% |
| Immigrants | Sudan | 8.7 /100 | #213 | Tragic 96.8% |
| Portuguese | 8.2 /100 | #214 | Tragic 96.8% |
| Sierra Leoneans | 8.0 /100 | #215 | Tragic 96.8% |
| Paiute | 7.8 /100 | #216 | Tragic 96.8% |
| Liberians | 7.5 /100 | #217 | Tragic 96.8% |
| Navajo | 7.3 /100 | #218 | Tragic 96.8% |
| Costa Ricans | 6.8 /100 | #219 | Tragic 96.8% |
| Immigrants | Morocco | 6.2 /100 | #220 | Tragic 96.7% |
| Tongans | 6.1 /100 | #221 | Tragic 96.7% |
| Immigrants | Syria | 5.9 /100 | #222 | Tragic 96.7% |
| Bahamians | 4.8 /100 | #223 | Tragic 96.7% |
| Immigrants | Southern Europe | 4.4 /100 | #224 | Tragic 96.7% |
Demographics Similar to Immigrants from Nigeria by 6th Grade
In terms of 6th grade, the demographic groups most similar to Immigrants from Nigeria are Immigrants from Colombia (96.4%, a difference of 0.010%), Armenian (96.4%, a difference of 0.020%), Immigrants from Jamaica (96.4%, a difference of 0.020%), Ghanaian (96.4%, a difference of 0.030%), and Afghan (96.4%, a difference of 0.030%).
| Demographics | Rating | Rank | 6th Grade |
| Immigrants | Congo | 0.6 /100 | #255 | Tragic 96.5% |
| U.S. Virgin Islanders | 0.5 /100 | #256 | Tragic 96.5% |
| Taiwanese | 0.5 /100 | #257 | Tragic 96.5% |
| Immigrants | China | 0.4 /100 | #258 | Tragic 96.4% |
| South Americans | 0.4 /100 | #259 | Tragic 96.4% |
| Peruvians | 0.4 /100 | #260 | Tragic 96.4% |
| Immigrants | Sierra Leone | 0.4 /100 | #261 | Tragic 96.4% |
| Immigrants | Nigeria | 0.3 /100 | #262 | Tragic 96.4% |
| Immigrants | Colombia | 0.3 /100 | #263 | Tragic 96.4% |
| Armenians | 0.3 /100 | #264 | Tragic 96.4% |
| Immigrants | Jamaica | 0.2 /100 | #265 | Tragic 96.4% |
| Ghanaians | 0.2 /100 | #266 | Tragic 96.4% |
| Afghans | 0.2 /100 | #267 | Tragic 96.4% |
| Immigrants | Uzbekistan | 0.2 /100 | #268 | Tragic 96.3% |
| West Indians | 0.2 /100 | #269 | Tragic 96.3% |