Liberian vs Immigrants from Africa Householder Income Under 25 years
COMPARE
Liberian
Immigrants from Africa
Householder Income Under 25 years
Householder Income Under 25 years Comparison
Liberians
Immigrants from Africa
$48,917
HOUSEHOLDER INCOME UNDER 25 YEARS
0.0/ 100
METRIC RATING
288th/ 347
METRIC RANK
$50,609
HOUSEHOLDER INCOME UNDER 25 YEARS
2.0/ 100
METRIC RATING
245th/ 347
METRIC RANK
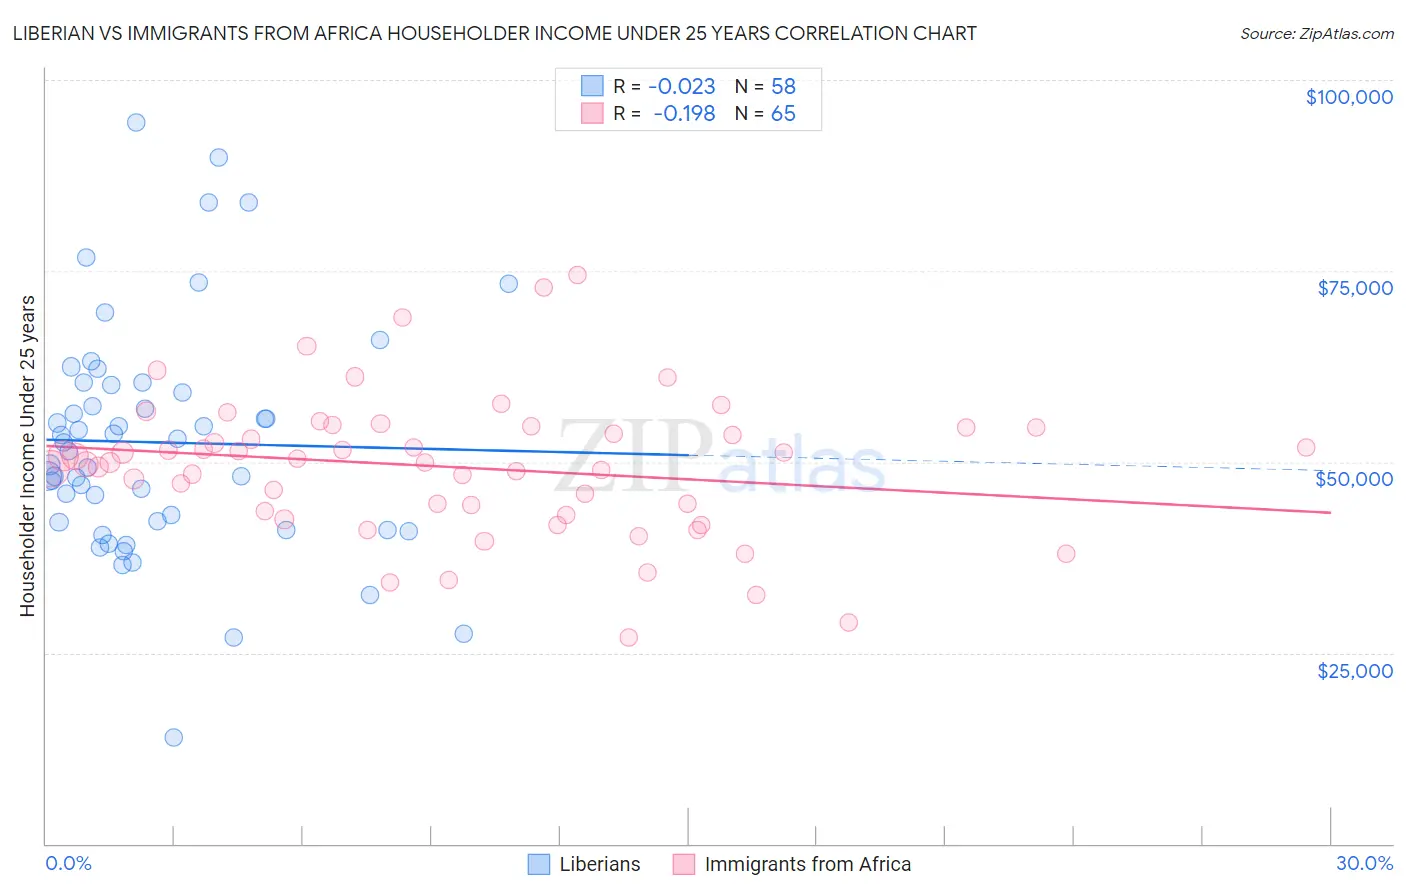
Liberian vs Immigrants from Africa Householder Income Under 25 years Correlation Chart
The statistical analysis conducted on geographies consisting of 110,653,679 people shows no correlation between the proportion of Liberians and household income with householder under the age of 25 in the United States with a correlation coefficient (R) of -0.023 and weighted average of $48,917. Similarly, the statistical analysis conducted on geographies consisting of 387,551,997 people shows a poor negative correlation between the proportion of Immigrants from Africa and household income with householder under the age of 25 in the United States with a correlation coefficient (R) of -0.198 and weighted average of $50,609, a difference of 3.5%.
Householder Income Under 25 years Correlation Summary
| Measurement | Liberian | Immigrants from Africa |
| Minimum | $13,942 | $26,950 |
| Maximum | $94,479 | $74,456 |
| Range | $80,537 | $47,507 |
| Mean | $52,552 | $49,315 |
| Median | $51,943 | $49,967 |
| Interquartile 25% (IQ1) | $42,067 | $43,274 |
| Interquartile 75% (IQ3) | $60,104 | $54,425 |
| Interquartile Range (IQR) | $18,037 | $11,151 |
| Standard Deviation (Sample) | $15,238 | $9,288 |
| Standard Deviation (Population) | $15,106 | $9,217 |
Similar Demographics by Householder Income Under 25 years
Demographics Similar to Liberians by Householder Income Under 25 years
In terms of householder income under 25 years, the demographic groups most similar to Liberians are Honduran ($48,885, a difference of 0.060%), Senegalese ($48,953, a difference of 0.070%), French American Indian ($48,977, a difference of 0.12%), American ($48,860, a difference of 0.12%), and Scotch-Irish ($49,039, a difference of 0.25%).
| Demographics | Rating | Rank | Householder Income Under 25 years |
| Immigrants | Nonimmigrants | 0.1 /100 | #281 | Tragic $49,348 |
| Alsatians | 0.1 /100 | #282 | Tragic $49,267 |
| Immigrants | Nigeria | 0.1 /100 | #283 | Tragic $49,174 |
| Carpatho Rusyns | 0.1 /100 | #284 | Tragic $49,113 |
| Scotch-Irish | 0.0 /100 | #285 | Tragic $49,039 |
| French American Indians | 0.0 /100 | #286 | Tragic $48,977 |
| Senegalese | 0.0 /100 | #287 | Tragic $48,953 |
| Liberians | 0.0 /100 | #288 | Tragic $48,917 |
| Hondurans | 0.0 /100 | #289 | Tragic $48,885 |
| Americans | 0.0 /100 | #290 | Tragic $48,860 |
| Immigrants | Burma/Myanmar | 0.0 /100 | #291 | Tragic $48,749 |
| Shoshone | 0.0 /100 | #292 | Tragic $48,720 |
| Sub-Saharan Africans | 0.0 /100 | #293 | Tragic $48,691 |
| Somalis | 0.0 /100 | #294 | Tragic $48,657 |
| Central American Indians | 0.0 /100 | #295 | Tragic $48,643 |
Demographics Similar to Immigrants from Africa by Householder Income Under 25 years
In terms of householder income under 25 years, the demographic groups most similar to Immigrants from Africa are Welsh ($50,597, a difference of 0.020%), Marshallese ($50,627, a difference of 0.040%), Immigrants from Thailand ($50,645, a difference of 0.070%), Cuban ($50,655, a difference of 0.090%), and Immigrants from Bosnia and Herzegovina ($50,565, a difference of 0.090%).
| Demographics | Rating | Rank | Householder Income Under 25 years |
| Iraqis | 3.2 /100 | #238 | Tragic $50,802 |
| Immigrants | Caribbean | 2.9 /100 | #239 | Tragic $50,757 |
| Immigrants | Lebanon | 2.7 /100 | #240 | Tragic $50,729 |
| Immigrants | Micronesia | 2.5 /100 | #241 | Tragic $50,691 |
| Cubans | 2.3 /100 | #242 | Tragic $50,655 |
| Immigrants | Thailand | 2.2 /100 | #243 | Tragic $50,645 |
| Marshallese | 2.1 /100 | #244 | Tragic $50,627 |
| Immigrants | Africa | 2.0 /100 | #245 | Tragic $50,609 |
| Welsh | 2.0 /100 | #246 | Tragic $50,597 |
| Immigrants | Bosnia and Herzegovina | 1.8 /100 | #247 | Tragic $50,565 |
| Slavs | 1.8 /100 | #248 | Tragic $50,563 |
| Scottish | 1.8 /100 | #249 | Tragic $50,554 |
| Immigrants | Cabo Verde | 1.7 /100 | #250 | Tragic $50,520 |
| Celtics | 1.4 /100 | #251 | Tragic $50,447 |
| Immigrants | Mexico | 1.3 /100 | #252 | Tragic $50,422 |