Liberian vs Houma Householder Income Under 25 years
COMPARE
Liberian
Houma
Householder Income Under 25 years
Householder Income Under 25 years Comparison
Liberians
Houma
$48,917
HOUSEHOLDER INCOME UNDER 25 YEARS
0.0/ 100
METRIC RATING
288th/ 347
METRIC RANK
$44,356
HOUSEHOLDER INCOME UNDER 25 YEARS
0.0/ 100
METRIC RATING
341st/ 347
METRIC RANK
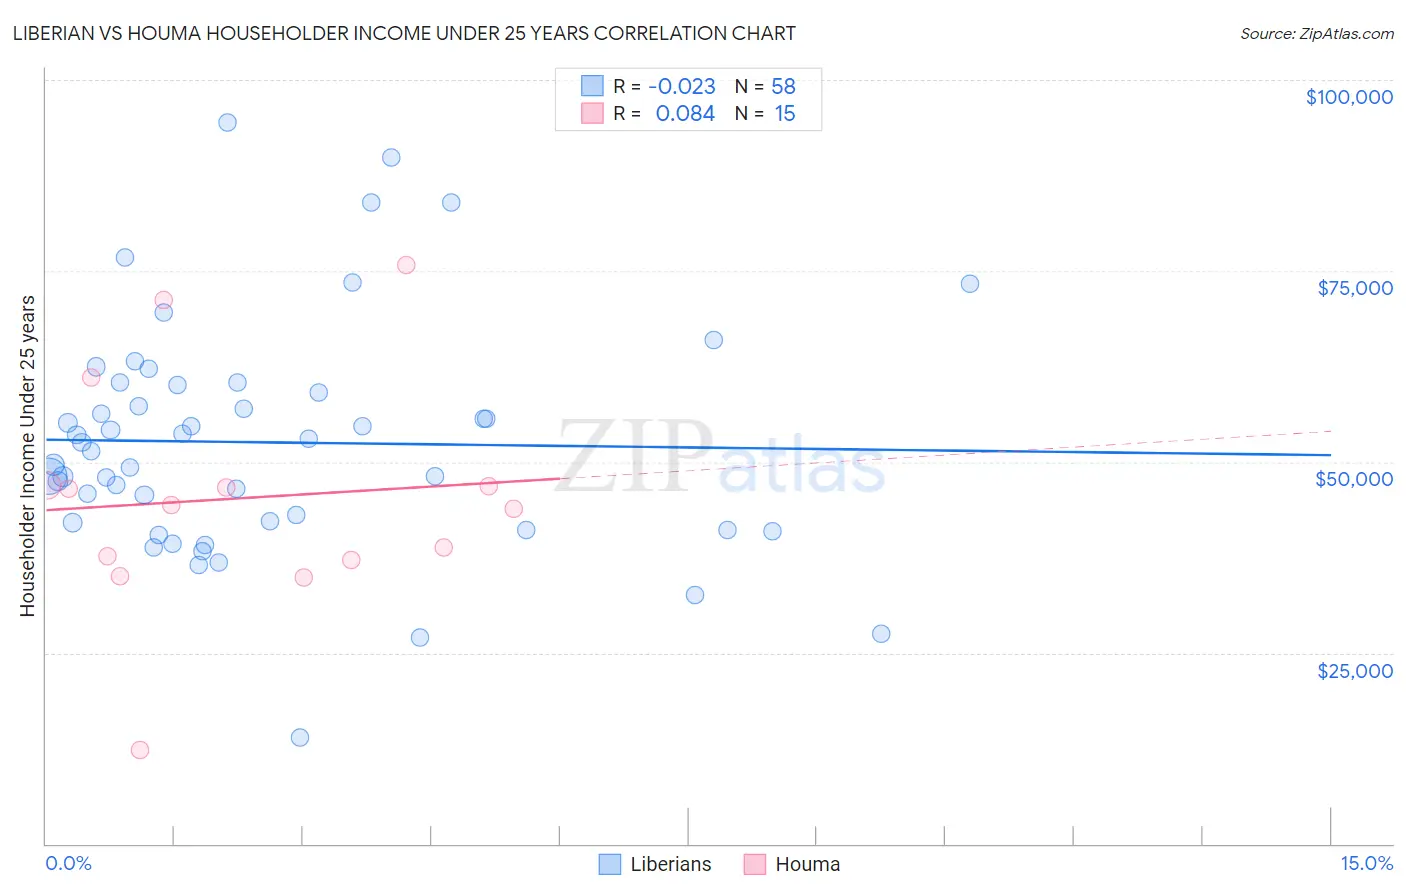
Liberian vs Houma Householder Income Under 25 years Correlation Chart
The statistical analysis conducted on geographies consisting of 110,653,679 people shows no correlation between the proportion of Liberians and household income with householder under the age of 25 in the United States with a correlation coefficient (R) of -0.023 and weighted average of $48,917. Similarly, the statistical analysis conducted on geographies consisting of 35,697,476 people shows a slight positive correlation between the proportion of Houma and household income with householder under the age of 25 in the United States with a correlation coefficient (R) of 0.084 and weighted average of $44,356, a difference of 10.3%.
Householder Income Under 25 years Correlation Summary
| Measurement | Liberian | Houma |
| Minimum | $13,942 | $12,212 |
| Maximum | $94,479 | $75,747 |
| Range | $80,537 | $63,535 |
| Mean | $52,552 | $45,249 |
| Median | $51,943 | $44,434 |
| Interquartile 25% (IQ1) | $42,067 | $37,081 |
| Interquartile 75% (IQ3) | $60,104 | $46,891 |
| Interquartile Range (IQR) | $18,037 | $9,810 |
| Standard Deviation (Sample) | $15,238 | $15,434 |
| Standard Deviation (Population) | $15,106 | $14,910 |
Similar Demographics by Householder Income Under 25 years
Demographics Similar to Liberians by Householder Income Under 25 years
In terms of householder income under 25 years, the demographic groups most similar to Liberians are Honduran ($48,885, a difference of 0.060%), Senegalese ($48,953, a difference of 0.070%), French American Indian ($48,977, a difference of 0.12%), American ($48,860, a difference of 0.12%), and Scotch-Irish ($49,039, a difference of 0.25%).
| Demographics | Rating | Rank | Householder Income Under 25 years |
| Immigrants | Nonimmigrants | 0.1 /100 | #281 | Tragic $49,348 |
| Alsatians | 0.1 /100 | #282 | Tragic $49,267 |
| Immigrants | Nigeria | 0.1 /100 | #283 | Tragic $49,174 |
| Carpatho Rusyns | 0.1 /100 | #284 | Tragic $49,113 |
| Scotch-Irish | 0.0 /100 | #285 | Tragic $49,039 |
| French American Indians | 0.0 /100 | #286 | Tragic $48,977 |
| Senegalese | 0.0 /100 | #287 | Tragic $48,953 |
| Liberians | 0.0 /100 | #288 | Tragic $48,917 |
| Hondurans | 0.0 /100 | #289 | Tragic $48,885 |
| Americans | 0.0 /100 | #290 | Tragic $48,860 |
| Immigrants | Burma/Myanmar | 0.0 /100 | #291 | Tragic $48,749 |
| Shoshone | 0.0 /100 | #292 | Tragic $48,720 |
| Sub-Saharan Africans | 0.0 /100 | #293 | Tragic $48,691 |
| Somalis | 0.0 /100 | #294 | Tragic $48,657 |
| Central American Indians | 0.0 /100 | #295 | Tragic $48,643 |
Demographics Similar to Houma by Householder Income Under 25 years
In terms of householder income under 25 years, the demographic groups most similar to Houma are Black/African American ($44,381, a difference of 0.060%), Arapaho ($44,003, a difference of 0.80%), Kiowa ($44,733, a difference of 0.85%), Chickasaw ($44,763, a difference of 0.92%), and Pueblo ($45,018, a difference of 1.5%).
| Demographics | Rating | Rank | Householder Income Under 25 years |
| Creek | 0.0 /100 | #333 | Tragic $45,371 |
| Cajuns | 0.0 /100 | #334 | Tragic $45,338 |
| Cheyenne | 0.0 /100 | #335 | Tragic $45,275 |
| Tohono O'odham | 0.0 /100 | #336 | Tragic $45,248 |
| Pueblo | 0.0 /100 | #337 | Tragic $45,018 |
| Chickasaw | 0.0 /100 | #338 | Tragic $44,763 |
| Kiowa | 0.0 /100 | #339 | Tragic $44,733 |
| Blacks/African Americans | 0.0 /100 | #340 | Tragic $44,381 |
| Houma | 0.0 /100 | #341 | Tragic $44,356 |
| Arapaho | 0.0 /100 | #342 | Tragic $44,003 |
| Immigrants | Yemen | 0.0 /100 | #343 | Tragic $43,591 |
| Immigrants | Congo | 0.0 /100 | #344 | Tragic $43,266 |
| Navajo | 0.0 /100 | #345 | Tragic $42,380 |
| Puerto Ricans | 0.0 /100 | #346 | Tragic $39,726 |
| Lumbee | 0.0 /100 | #347 | Tragic $34,584 |