Latvian vs Hopi Median Male Earnings
COMPARE
Latvian
Hopi
Median Male Earnings
Median Male Earnings Comparison
Latvians
Hopi
$63,498
MEDIAN MALE EARNINGS
100.0/ 100
METRIC RATING
31st/ 347
METRIC RANK
$42,060
MEDIAN MALE EARNINGS
0.0/ 100
METRIC RATING
341st/ 347
METRIC RANK
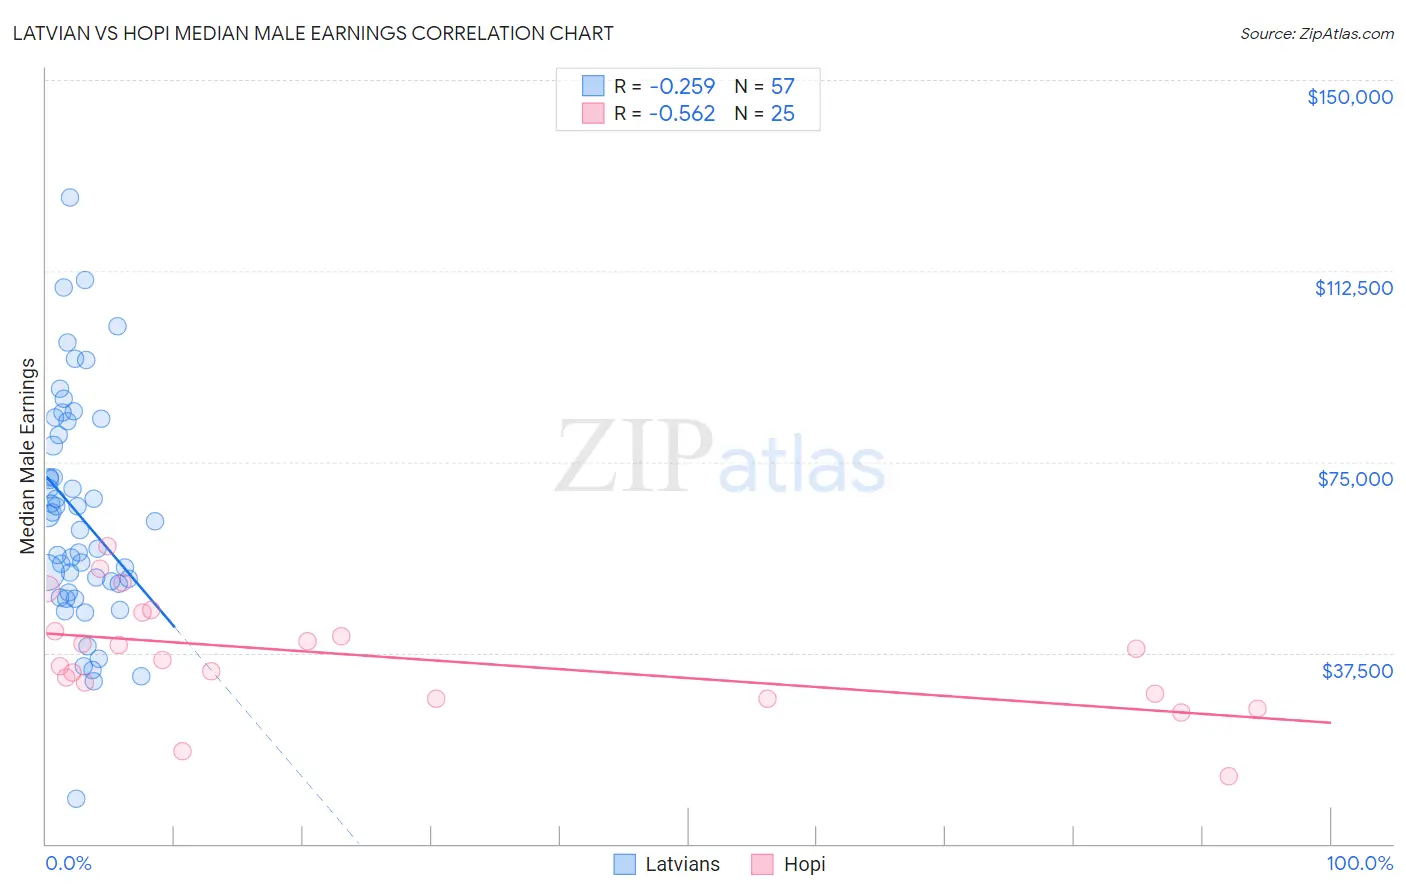
Latvian vs Hopi Median Male Earnings Correlation Chart
The statistical analysis conducted on geographies consisting of 220,682,058 people shows a weak negative correlation between the proportion of Latvians and median male earnings in the United States with a correlation coefficient (R) of -0.259 and weighted average of $63,498. Similarly, the statistical analysis conducted on geographies consisting of 74,728,825 people shows a substantial negative correlation between the proportion of Hopi and median male earnings in the United States with a correlation coefficient (R) of -0.562 and weighted average of $42,060, a difference of 51.0%.
Median Male Earnings Correlation Summary
| Measurement | Latvian | Hopi |
| Minimum | $8,856 | $13,333 |
| Maximum | $126,871 | $58,516 |
| Range | $118,015 | $45,183 |
| Mean | $64,757 | $36,698 |
| Median | $63,438 | $36,172 |
| Interquartile 25% (IQ1) | $50,186 | $29,042 |
| Interquartile 75% (IQ3) | $81,584 | $43,616 |
| Interquartile Range (IQR) | $31,398 | $14,573 |
| Standard Deviation (Sample) | $22,394 | $10,705 |
| Standard Deviation (Population) | $22,197 | $10,489 |
Similar Demographics by Median Male Earnings
Demographics Similar to Latvians by Median Male Earnings
In terms of median male earnings, the demographic groups most similar to Latvians are Soviet Union ($63,382, a difference of 0.18%), Immigrants from Lithuania ($63,346, a difference of 0.24%), Immigrants from Russia ($63,326, a difference of 0.27%), Immigrants from France ($63,715, a difference of 0.34%), and Immigrants from Asia ($63,240, a difference of 0.41%).
| Demographics | Rating | Rank | Median Male Earnings |
| Immigrants | Northern Europe | 100.0 /100 | #24 | Exceptional $64,987 |
| Immigrants | Denmark | 100.0 /100 | #25 | Exceptional $64,625 |
| Turks | 100.0 /100 | #26 | Exceptional $64,253 |
| Immigrants | Switzerland | 100.0 /100 | #27 | Exceptional $63,944 |
| Russians | 100.0 /100 | #28 | Exceptional $63,939 |
| Asians | 100.0 /100 | #29 | Exceptional $63,827 |
| Immigrants | France | 100.0 /100 | #30 | Exceptional $63,715 |
| Latvians | 100.0 /100 | #31 | Exceptional $63,498 |
| Soviet Union | 100.0 /100 | #32 | Exceptional $63,382 |
| Immigrants | Lithuania | 100.0 /100 | #33 | Exceptional $63,346 |
| Immigrants | Russia | 100.0 /100 | #34 | Exceptional $63,326 |
| Immigrants | Asia | 100.0 /100 | #35 | Exceptional $63,240 |
| Israelis | 100.0 /100 | #36 | Exceptional $63,228 |
| Immigrants | Sri Lanka | 100.0 /100 | #37 | Exceptional $63,099 |
| Maltese | 100.0 /100 | #38 | Exceptional $62,953 |
Demographics Similar to Hopi by Median Male Earnings
In terms of median male earnings, the demographic groups most similar to Hopi are Navajo ($42,098, a difference of 0.090%), Pima ($42,357, a difference of 0.71%), Arapaho ($41,758, a difference of 0.72%), Lumbee ($41,715, a difference of 0.83%), and Crow ($42,434, a difference of 0.89%).
| Demographics | Rating | Rank | Median Male Earnings |
| Immigrants | Congo | 0.0 /100 | #333 | Tragic $44,204 |
| Immigrants | Yemen | 0.0 /100 | #334 | Tragic $44,083 |
| Spanish American Indians | 0.0 /100 | #335 | Tragic $44,010 |
| Immigrants | Cuba | 0.0 /100 | #336 | Tragic $43,461 |
| Menominee | 0.0 /100 | #337 | Tragic $42,581 |
| Crow | 0.0 /100 | #338 | Tragic $42,434 |
| Pima | 0.0 /100 | #339 | Tragic $42,357 |
| Navajo | 0.0 /100 | #340 | Tragic $42,098 |
| Hopi | 0.0 /100 | #341 | Tragic $42,060 |
| Arapaho | 0.0 /100 | #342 | Tragic $41,758 |
| Lumbee | 0.0 /100 | #343 | Tragic $41,715 |
| Pueblo | 0.0 /100 | #344 | Tragic $41,314 |
| Puerto Ricans | 0.0 /100 | #345 | Tragic $40,071 |
| Tohono O'odham | 0.0 /100 | #346 | Tragic $39,543 |
| Yup'ik | 0.0 /100 | #347 | Tragic $39,504 |