Latvian vs Fijian Median Male Earnings
COMPARE
Latvian
Fijian
Median Male Earnings
Median Male Earnings Comparison
Latvians
Fijians
$63,498
MEDIAN MALE EARNINGS
100.0/ 100
METRIC RATING
31st/ 347
METRIC RANK
$45,607
MEDIAN MALE EARNINGS
0.0/ 100
METRIC RATING
321st/ 347
METRIC RANK
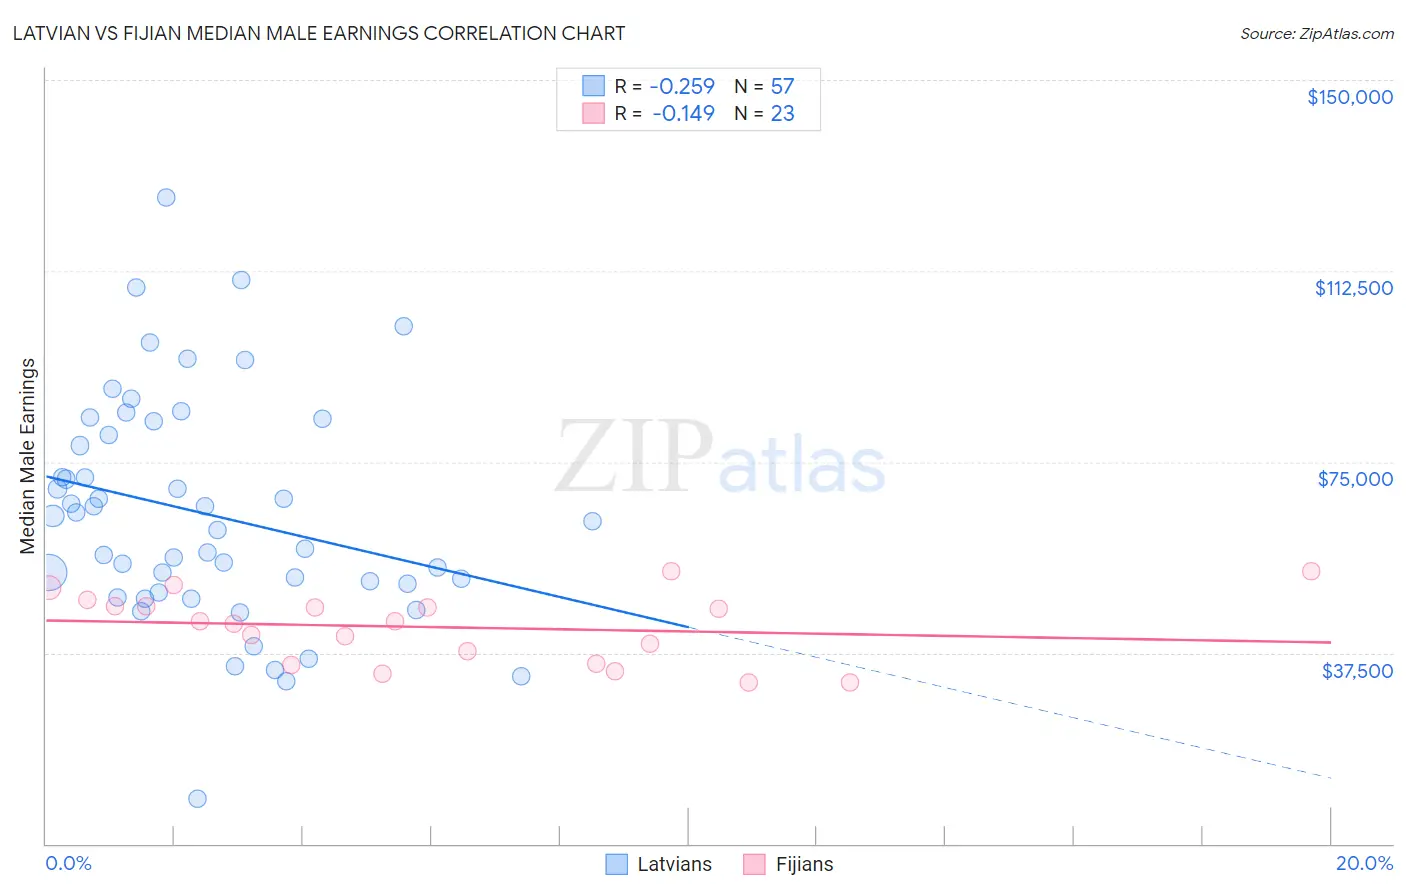
Latvian vs Fijian Median Male Earnings Correlation Chart
The statistical analysis conducted on geographies consisting of 220,682,058 people shows a weak negative correlation between the proportion of Latvians and median male earnings in the United States with a correlation coefficient (R) of -0.259 and weighted average of $63,498. Similarly, the statistical analysis conducted on geographies consisting of 55,945,280 people shows a poor negative correlation between the proportion of Fijians and median male earnings in the United States with a correlation coefficient (R) of -0.149 and weighted average of $45,607, a difference of 39.2%.
Median Male Earnings Correlation Summary
| Measurement | Latvian | Fijian |
| Minimum | $8,856 | $31,736 |
| Maximum | $126,871 | $53,542 |
| Range | $118,015 | $21,806 |
| Mean | $64,757 | $42,546 |
| Median | $63,438 | $43,625 |
| Interquartile 25% (IQ1) | $50,186 | $35,286 |
| Interquartile 75% (IQ3) | $81,584 | $46,656 |
| Interquartile Range (IQR) | $31,398 | $11,370 |
| Standard Deviation (Sample) | $22,394 | $6,788 |
| Standard Deviation (Population) | $22,197 | $6,639 |
Similar Demographics by Median Male Earnings
Demographics Similar to Latvians by Median Male Earnings
In terms of median male earnings, the demographic groups most similar to Latvians are Soviet Union ($63,382, a difference of 0.18%), Immigrants from Lithuania ($63,346, a difference of 0.24%), Immigrants from Russia ($63,326, a difference of 0.27%), Immigrants from France ($63,715, a difference of 0.34%), and Immigrants from Asia ($63,240, a difference of 0.41%).
| Demographics | Rating | Rank | Median Male Earnings |
| Immigrants | Northern Europe | 100.0 /100 | #24 | Exceptional $64,987 |
| Immigrants | Denmark | 100.0 /100 | #25 | Exceptional $64,625 |
| Turks | 100.0 /100 | #26 | Exceptional $64,253 |
| Immigrants | Switzerland | 100.0 /100 | #27 | Exceptional $63,944 |
| Russians | 100.0 /100 | #28 | Exceptional $63,939 |
| Asians | 100.0 /100 | #29 | Exceptional $63,827 |
| Immigrants | France | 100.0 /100 | #30 | Exceptional $63,715 |
| Latvians | 100.0 /100 | #31 | Exceptional $63,498 |
| Soviet Union | 100.0 /100 | #32 | Exceptional $63,382 |
| Immigrants | Lithuania | 100.0 /100 | #33 | Exceptional $63,346 |
| Immigrants | Russia | 100.0 /100 | #34 | Exceptional $63,326 |
| Immigrants | Asia | 100.0 /100 | #35 | Exceptional $63,240 |
| Israelis | 100.0 /100 | #36 | Exceptional $63,228 |
| Immigrants | Sri Lanka | 100.0 /100 | #37 | Exceptional $63,099 |
| Maltese | 100.0 /100 | #38 | Exceptional $62,953 |
Demographics Similar to Fijians by Median Male Earnings
In terms of median male earnings, the demographic groups most similar to Fijians are Sioux ($45,566, a difference of 0.090%), Immigrants from Central America ($45,538, a difference of 0.15%), Black/African American ($45,523, a difference of 0.18%), Yuman ($45,446, a difference of 0.35%), and Immigrants from Honduras ($45,787, a difference of 0.39%).
| Demographics | Rating | Rank | Median Male Earnings |
| Chippewa | 0.0 /100 | #314 | Tragic $46,368 |
| Immigrants | Guatemala | 0.0 /100 | #315 | Tragic $46,244 |
| Immigrants | Caribbean | 0.0 /100 | #316 | Tragic $46,193 |
| Mexicans | 0.0 /100 | #317 | Tragic $46,147 |
| Cheyenne | 0.0 /100 | #318 | Tragic $46,062 |
| Haitians | 0.0 /100 | #319 | Tragic $45,903 |
| Immigrants | Honduras | 0.0 /100 | #320 | Tragic $45,787 |
| Fijians | 0.0 /100 | #321 | Tragic $45,607 |
| Sioux | 0.0 /100 | #322 | Tragic $45,566 |
| Immigrants | Central America | 0.0 /100 | #323 | Tragic $45,538 |
| Blacks/African Americans | 0.0 /100 | #324 | Tragic $45,523 |
| Yuman | 0.0 /100 | #325 | Tragic $45,446 |
| Immigrants | Haiti | 0.0 /100 | #326 | Tragic $45,266 |
| Immigrants | Bahamas | 0.0 /100 | #327 | Tragic $45,176 |
| Kiowa | 0.0 /100 | #328 | Tragic $45,094 |